A loss of trust and the Quiet Revolution in Corporate Governance

"Payouts to shareholders reduce the resources under manager's control, thereby reducing managers' power...Conflicts of interest between shareholders and managers are especially severe when the organisation generates substantial free cash flow.  The problem is how to motivate managers to disgorge the cash rather than invest it at or below the cost of capital... "

- Professor Michael Jensen, 1986, Agency costs of free cash flow, corporate finance and takeovers, American Economic Review

Commentators and analysts continue to be vocal critics of the insatiable appetite for income that investors have developed in recent years.  The argument goes that this trend has encouraged companies to return capital back to shareholders in the form of higher dividends and buy-backs, at the expense of investing for future growth.  Thus, companies are apparently foregoing valuable growth opportunities stemming from investors' short-termism.  Although record low interest rates has probably contributed to the 'reach for yield' in financial markets, this post argues that investors' loss of trust in CEOs' ability to undertake value accretive projects and acquisitions has had an important influence on corporate payout policies.  Moreover, the greater propensity for companies to return capital back to shareholders has been far more powerful in reducing the agency costs of free cash flow than the noise created by the bloated ESG industry.

Since the turn of the century, the finance industry has becoming increasingly noisy in extolling the virtues of good corporate governance thanks to a number of high profile governance failures, including (but not limited to) Enron, Parmalat, Tyco, WorldCom, Lehman Bros and closer to home, HIH Insurance.

Australian asset managers have led their world in their march to being good corporate citizens; the take up of the United Nations Principles of Responsible Investing is among the highest in the world.  The mainstreaming of environmental, governance and social factors (ESG) has meant that most active funds showcase their ability to incorporate ESG into their investment processes. 

Many ASX listed companies have catered to the greater investor appetite for good governance by appointing more independent board directors, lifting the level of disclosure in annual reports, adopting remuneration structures that are designed to align the interests of senior management and shareholders, establishing audit and remuneration committees, and separating the roles of chairperson and CEO.  CEOs are astute enough to give investors what they want, particularly if it involves a low cost, low effort box ticking exercise.  Little surprise then that there has been a pattern of inflation in governance scores over the past decade, but it is far from clear that the greater awareness of governance issues has properly addressed the classic agency conflict that arises from the separation of ownership and management of corporate assets. 

Despite the 'noisy' revolution in corporate governance (and ESG more generally), has the upheaval in governance practices led to improved company outcomes globally?  In their pioneering study published in 2003, Paul Gompers et al demonstrated a strong empirical link between governance and performance in the United States through the 1990s; stocks with strong shareholder rights strongly outperformed and had higher firm value, higher profits, stronger sales growth, lower capital expenditures and undertook fewer corporate acquisitions.  But a more recently published study in 2012 by Lucian Bebchuk et al shows that although well governed firms continued to exhibit superior operating performance from 2000-08, they did not outperform stocks with weak shareholder rights.  The authors attribute their finding to investor learning;  there was a greater awareness of, and attention paid to governance by investors, which meant that good governance was already impounded into stock prices.

Anecdotal evidence also casts doubt on the link between good governance and stock returns; firms with weak shareholder rights and few independent board directors continue to deliver strong stock returns, including Apple, Newscorp, Westfield and Harvey Norman to name a few.

In his pioneering study from almost three decades ago, Michael Jensen argued that the separation of ownership and management of corporate assets gives rise to more severe agency conflicts when a company generates strong free cash flow, because there is scope for the CEO and senior executives to use the free cash flow to expand the size of the firm at the expense of profitability and shareholder returns.  Returning cash to shareholders therefore imposes a powerful discipline on the CEO, "...making it more likely they will incur the monitoring of the capital markets which occurs when the firm must obtain new capital."

Australian firms have for a while now had a higher dividend payout ratio than their global peers thanks to the adoption of the imputation system in 1987, which eliminates the double taxation of corporate profits that are paid out as dividends since shareholders receive an imputation credit for the tax already paid on profits by the company.  The aggregate payout ratio started to lift from the 1980s.

But more recently, companies have increasingly resorted to returning cash to shareholders in preference to re-investment and acquisitions.  For starters, dividend concentration has risen; the top 10 dividend payers in Australia generate  60% of aggregate dividends paid by All Ordinaries companies, well above the 43% generated at the peak of the credit boom in 2007 (see chart). 

Second, the aggregate payout ratio has lifted in recent years, to its current level of 70%, above the median of 65% since 1990 and well above historical trends over the past forty years (see chart).  The payout ratio has exhibited a strong cyclical pattern since the early 1990s, with sharp rises associated with either a contraction or stagnation in earnings, while the aggregate dividend per share has exhibited far less variability, confirming that companies engage in dividend smoothing.

The sustained lift in the payout ratio represents the flip-side of the corporate sector's dormant animal spirits.  The RBA Governor, Mr Glenn Stevens, has bemoaned the lack of risk taking in corporate Australia and implored businesses to invest for future growth.  But more recently, Mr Stevens and the RBA have acknowledged that the hurdle rates used by companies to evaluate future projects has remained sticky despite the fact that 10 year government bond yields remain close to record lows.

The financial crisis continues to cast a long shadow

I believe that the insatiable appetite for income that investors have developed has arisen in large part to a loss of trust in CEOs' ability and willingness to undertake value accretive projects and acquisitions.  The poor track record of acquisition led growth through the credit boom of the mid-2000s has left investors justifiably cynical of CEOs' motives: RIO, BHP and QBE are just some that come to mind that have undermined investors' confidence.

Marrying payout and predictability

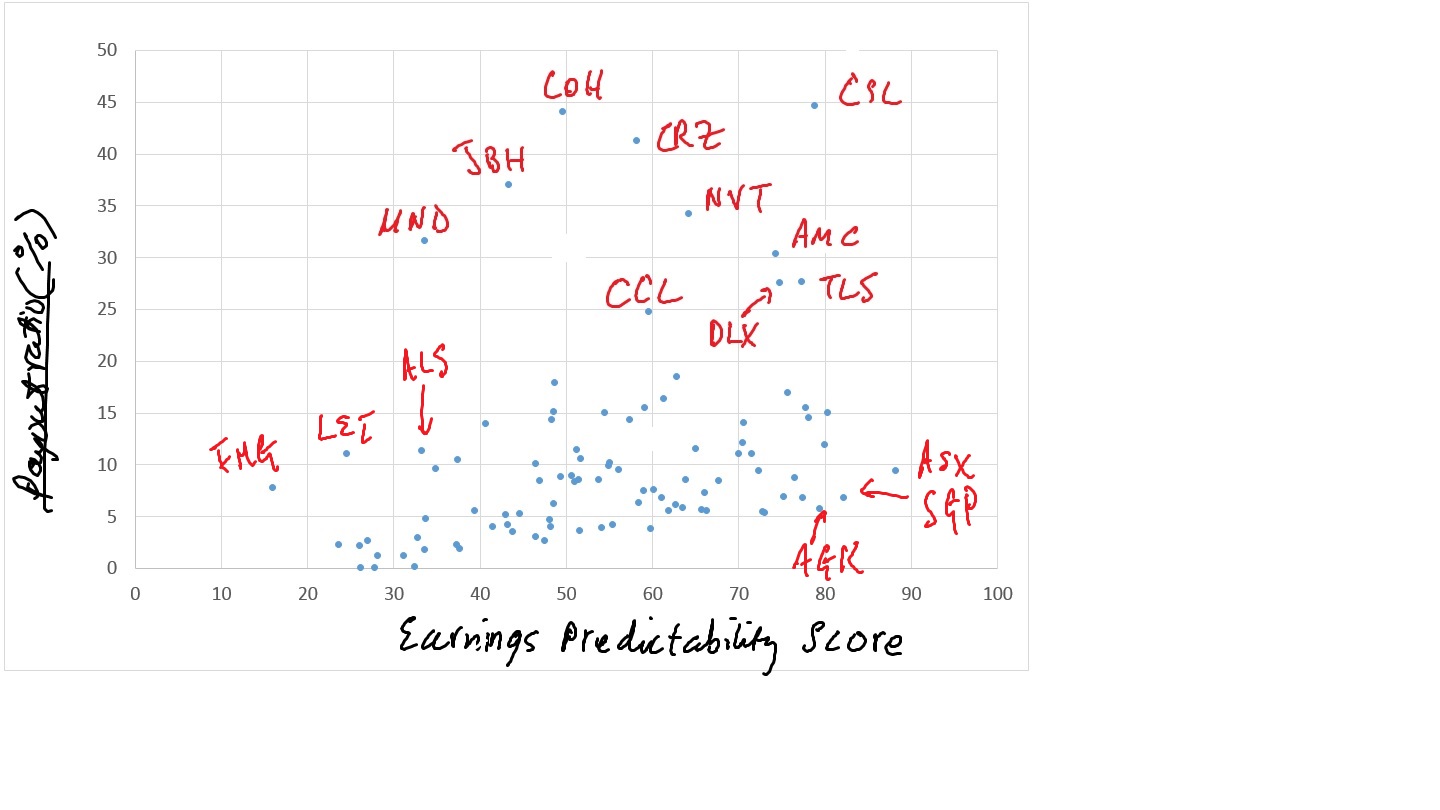
I have developed a score for a company's payout ratio based on past dividends paid and stock buy-backs undertaken (see chart below).  I use total assets rather than EPS as the scaling variable due to the volatility and cyclicality of EPS for some companies.  Stocks that rank strongly across this metric include CSL, COH and CAR. 

Separately, I have developed a proprietary composite indicator for a stock's earnings predictability based on five variables.  The chart below plots the earnings predictability score against the aggregate payout ratio.  The plot identifies a number of stocks with potentially unsustainably high payout ratios because their predictability scores fall below the median, notably JBH and MND.  Three stocks that appear to have scope to lift their payout ratios due to their strong earnings predictability include: ASX, SGP and AGK. 

The other revolution in corporate governance

It is a welcome development that CEOs with a track record of acquisitive growth no longer command a premium in the market for managerial talent.  Boards increasingly are looking for CEO candidates that have a track record of prudence and cost control, and that exhibit a willingness to abandon under-performing assets that in the past might have been seen to represent future growth options, but are increasingly now viewed as peripheral and distracting from the company's core focus.  This 'other' revolution in corporate governance will be the subject of a forthcoming report from Evidente.


Woolworths - Risk Reward Becomes More Compelling

Last month, Evidente published an open letter to the Woolworths CEO, Grant O'Brien, suggesting that a lack of corporate focus had contributed to the company's poor recent performance.  The rollout of Masters stores since 2011 had been a significant drag on the group's performance, with the company having little choice but to push out the timing of break-even expectations from what in hindsight was an unrealistically aggressive timetable. 

The slowdown in sales growth of Australian Food & Liquor segment evident in the past year suggests that the expansion into home improvement has distracted management from its core supermarket business and taken up a disproportionate amount of management time and effort.  Woolworths has effectively bucked the recent trend towards corporate focus; the demerger wave of recent years amounts to corporate Australia waving the white flag on corporate diversification and acknowledging that focussed firms typically produce superior returns to their shareholders.

In an encouraging sign at the investor strategy day in early May, Mr O'Brien announced that Woolworths would re-allocate capital away from the under-performing Masters and Big W businesses towards supermarkets, including for store refurbishment.  Whether this represents a harbinger of an exit from these businesses remains to be seen.  In what amounted to a mea culpa, Mr O'Brien admitted that in seeking to preserve high margins, the supermarkets division had effectively sacrificed sales growth and customer loyalty, and flagged a shift in strategy designed to neutralise the community perception of Coles' price leadership.

Despite my ongoing concerns about the ability for the senior executives to effectively manage a number of disparate and under-performing businesses in the near term, particularly Big W and home improvement, the following set of charts suggest that at current levels, analysts and investors have become unduly pessimistic about the company's prospects. 

First, multiple contraction - rather than earnings contraction - has accounted for the lion's share of the stock's underperformance in the past year.  The 12mth forward earnings multiple has declined to 14x from 17.5x (see top panel of the chart below).  The bottom panel confirms that a continued deterioration of the company's incremental ROE coincided with the roll-out of the Masters stores which commenced in 2011, coinciding with the start of Mr O'Brien's tenure as CEO. 

Second, the stock is now trading at 14x 12mth forward earnings, which is a discount to the ASX200 (16x).  This represents the first time Woolworths has traded at a discount (see chart).

Third, Woolworths is trading at a discount to its global food & grocery peers based on profitability adjusted price to book ratios.  Valuation theory says that there ought to be a positive and linear relationship between a stock's expected ROE and its P/B ratio, and the positive regression line in the chart below confirms this.  After having traded typically at or above the regression line in recent years, Woolworths is now trading at a 10% discount based on this metric.

As analysts have downgraded its ROE outlook, the stock has undergone a material de-rating, particularly in the past year.  The chart below highlights the extent of the de-rating, and shows that if the stock's profitability adjusted P/B ratio was in line with its peers, it would be trading on a book multiple of 3.8x.

Fourth, when benchmarked against the stocks in the ASX100, Woolworths also offers compelling value.  Its profitability adjusted P/B ratio is more than 20% below the regression line (see chart).  A closer inspection of valuation theory suggests that this discount is unlikely to persist.  The perpetuity earnings discount model says that a stock's P/B ratio is equal to its future expected ROE multiplied by the reciprocal of k - g (expected stock return minus future expected growth in EPS).  The CAPM dictates that the only source of variation across stocks' expected returns is in a stock's beta; high beta stocks ought to trade at a discount, other things being equal.  So a stock's book multiple might remain below the regression line in equilibrium if has a higher beta than its peers and/or lower EPS growth expectations.

Woolworths' risk and growth characteristics suggest that it should not remain below the regression line for an extended period.  The lion's share of the company's revenues are generated in segments that are considered to be defensive, and most analysts use betas of less than 1 when constructing their discount cash flow valuations. So controlling for expected future growth, Woolworths ought to trade on a premium based on profitability adjusted P/B ratios. 

Moreover, long-term consensus expectations suggest that sell-side analysts have become too pessimistic about the stock's future growth prospects.  The long term growth forecast for the stock has fallen to only 2%, well below the median estimate (see chart).  Over the sweep of the past five decades, household spending on food & liquor has broadly tracked growth in the economy of around 5.5%.  Concerns around management quality and the long-term viability of home improvement are valid but in my view, do not justify the stock trading at a discount to its large cap peers.

Fifth, parallels between Tesco and Woolworths are exaggerated.  The collapse in Tesco's share price in 2014 owes much to the lack of transparency of its financial accounts following an accounting scandal.  Moreover, prior to the scandal, the stock was priced for perfection, trading at a large premium to its global peers on a profitability adjusted price to book ratio (see chart).  As discussed above, Woolworths is trading well below the regression line at present.

An excessive pessimism

I continue to have concerns around the long-term viability of the Masters stores in their current format, the fact that the composition senior management appears to be in a state of flux thanks to a number of recent departures, and remain sceptical of the purported synergies between running a supermarkets business and a being big box hardware retailer.  But in my view, the share price is already impounding excessive pessimism.  At these levels, investors should neutralise their underweight bet in the stock and use any renewed price weakness to start building an overweight position. 


The Jamie Durie Index, Re-visited

Inspired by Robert Shiller’s best seller, Irrational Exuberance, I developed the Jamie Durie Index (JDI) over a decade ago, which represented the number of times the name ‘Jamie Durie’ appeared in newspapers and magazines.  Shiller’s book suggested that the media typically play an important role in propagating asset price booms.  Jamie Durie -host of top rating TV show, The Block - was the poster boy of Australia’s property market culture and the JDI was designed to measure the media attention and chatter surrounding property.  As it happened, the JDI correlated closely with the cycle in house prices, with both peaking in 2003.

At the time, Australian property was booming, stories of house price gains achieved in no time with an assist from plenty of debt dominated dinner party conversation, and Australia was rapidly becoming a nation of home renovators, inspired by Jamie Durie and shows like The Block.

Fast forward to 2015 and The Block has come a long way, having out-lived its original host.  In its initial form, it survived only two seasons.  After a six year absence, the Nine Network re-introduced the show in 2010, which has been hosted by Scott Cam ever since.  Despite the 20% lift in average home values in the past three years, The Block and other home renovation shows – including House Rules and Reno Rumble - haven’t hit the heights of a decade earlier.

The rise and rise of home renovation shows...

The recently appointed Treasury Secretary, Mr John Fraser, has weighed in on the debate about whether there is a bubble in property prices, suggesting that the plethora of home renovation television shows represents compelling evidence of over-investment in housing.  While there might be signs of a property market culture re-emerging, we need to tread carefully about drawing strong inferences about a property bubble for a number of reasons.

...but little sign of a speculative frenzy

First, a shift in consumer attitudes and tastes has contributed to the proliferation of home renovation shows.  For instance, the growing popularity of cooking shows, including Master Chef and My Kitchen Rules, together with the emergence of the celebrity chef, is largely due to the renewed interest in food and home cooking and a waning interest in processed foods.  Is anyone suggesting there is a bubble in home cooked food?

Second, the aggregate data doesn’t point to over-investment in housing, just yet.  Private sector dwelling investment has lifted to a little above 5% of GDP, but this remains well below prior peaks of around 6½% (see chart).

Third, despite the growing interest in home renovation shows, this has not yet translated into a lift in the share of their budgets that consumers devote to home renovations.  That much is obvious from the fact that the value of renovations declined to 1.8% of GDP in 2014, well below the peak of 2.7% of a decade ago and its lowest level in more than twenty years (see chart).  To put this in context, had the value of renovations accounted for 2.7% of GDP in 2014, this would have translated into a dollar value of $43 billion, well above the actual spending on renovations of $30 billion, representing a shortfall of over $10 billion.

The academic literature confirms that the level of home improvement activity provides a valuable insight into home owners' expectations of future price growth.  In a paper published in the Journal of Financial Economics, Harrison Hong and other researchers from Princeton show that in the United States, homeowners who are optimistic about future house prices are more likely to speculate on future price growth by renovating.

Fourth, increased liquidity, a pre-requisite for speculative bubbles according to Shiller, has been absent to date.  In fact, the annualised turnover rate of the stock of housing has declined to 4%, around half its level from a decade ago (see chart).  Normally, turnover rises with house prices because greater home equity encourages home-owners to trade up to more expensive homes and vendors who observe higher turnover infer that demand has picked up and lift their reserves.

The RBA speculates that various factors underpin muted housing turnover: the unusually low participation of owner-occupiers in housing market transactions and growing evidence that homeowners have become more reluctant to borrow against increases in net wealth to trade up homes.  Hardly ingredients of a property bubble.

Tipping point for a bubble has not been reached...yet

Despite the proliferation of home renovation shows on Australian television, signs of a re-emerging property market culture, and strong upswing in Sydney and Melbourne property prices, the modest level of renovation activity, low turnover in the housing stock and the fact that private sector dwelling investment is in line with historical norms suggests that the property market does not yet share the speculative elements that prevailed during the boom of the early 2000s.

Back then people renovated to cash in on the soaring equity in their home so they could trade up to bigger places.  Now, the reality has set in that the transaction costs of moving are too high and households are more realistic about their expectations of capital growth.  If there does exist a tipping point for the emerging property market culture to morph into a speculative frenzy of over-investment, I believe that we are not there yet.


A less cautious consumer: Good news for discretionary retailers (finally!)

The March quarter capex survey revealed that animal spirits in the corporate sector remain dormant, with little prospect of a pick-up in non-mining investment in the near term.  The dollar value of capex for 2014/15  is set to come in at around $145 billion, 10% lower than a year earlier.  But the greater concern is that preliminary business expectations for capex in 2015/16 are comparable to those that prevailed for 2010/11.  If that year turns out to be a reliable guide, then capex is set to decline to $120 billion in 2015/16, representing an annual decline of over 15% (see chart).

Unprecedented upheaval in the corporate landscape

Faced with persistent revenue headwinds, the corporate sector faces little choice but to trim costs aggressively, restructure and lift efficiency to boost profitability and free cash flow, thus catering to investors' insatiable appetite for income.  In its recent strategy day, Woodside Petroleum was the latest in a long line of resources companies that announced a renewed focus on achieving a step down in its cost structure and lift in productivity.  It is already on that path, with capex 10% lower in 2014, and has a target of achieving a further 10-20% capex reduction by 2016.  While energy gentailer, AGL, announced at its strategy briefing this week that it would target asset sales of up to $1 billion by 2016.  Against the backdrop of the demerger wave of recent years and trend towards corporate focus, the upheaval in Australia's corporate landscape is unprecedented.

The consumer is key for reviving animal spirits

Richard Goyder, Wesfarmers' CEO, said recently that he would need to see sustained evidence of a strong pick-up in consumer spending before the company would commit to a ramping up of capital spending plans.  No doubt, this feeling is widespread amongst CEOs and CFOs across corporate Australia. 

The cautious consumer has held back investment intentions for some time now.  Since the financial crisis, the household saving ratio has hovered at or above 10%, representing its highest level in over two decades.  That is, households have been saving $10 for every $100 of gross disposable income earned since the financial crisis.  At face value, this doesn't seem high.  But to put this into perspective, the household sector saved less than $5 for every $100 of gross disposable income earned in the ten years to 2008 (see chart). 

Permanent income matters

Clearly, scared by the financial crisis and the related sharp drop in the present value of their human capital, households have taken on the task of balance sheet repair.  The persistent high level of job anxiety and proximity of the financial crisis has effectively seen households assign higher discount rates to their stream of future expected earnings.  As a result, they have been more reluctant to bring forward spending from the future to the present, so little wonder that the stock of personal credit remains below its pre-crisis peak.  Elevated political uncertainty of recent years hasn't helped consumer confidence either.

Signs of a less cautious consumer emerging

But some preliminary signs of a less cautious consumer are starting to emerge.  First, the saving rate has been on a modest downward trend since 2012, clearly helped by renewed strength in house prices, particularly across Sydney and Melbourne.  The introduction of macro-prudential measures by APRA, designed to curb the rapid growth in lending to the investor segment,  will probably moderate capital growth compared to recent years.  But the still high level of the saving ratio suggests that the medium term risks are skewed to the downside.  As the financial crisis becomes more distant, households will gradually assign lower discount rates to their future incomes, thus lifting their permanent income and encouraging them to borrow to bring forward consumption.

Second, the modest decline in the saving rate of recent years has been associated with a material pick-up in spending on durable goods, including household goods and clothing, footwear & personal accessories (see chart).  Department store sales are the only category among durable goods that has yet to participate in the recovery.

Third, there has been some renewed strength in consumer sentiment in recent months.  The inherent volatility of the series advises caution in extrapolating monthly movements into the future.  Nonetheless, the positive reaction to the Federal Budget delivered in mid-May and the strong showing in the polls by the Coalition has helped to reduce some of the political uncertainty that seems to have been a defining characteristic of Australia in recent years, particularly since the balance of power in the Senate has resided with a number of independent cross benchers.  With this Budget, the Government seems to have neutralised the bad news stemming from last year's Budget, where it spooked the electorate with talk of budget repair, hailed the end of the era of entitlement and failed to prosecute the case for the $7 Medicare co-payment.  Indeed, it is instructive that less than two weeks since the Budget was delivered, the ALP, the opposition party, has shifted the political debate to gay marriage.  Households have clearly welcomed the non-controversial budget as good news.  Consequently, I would expect that political uncertainty will continue to diminish and provide support to consumer sentiment in the near term.

The key risks to my view that the consumer will become less cautious relate to house prices, labour market slack and the already high level of household debt.  First, APRA's untested macro-prudential policies could provide a catalyst for renewed weakness in house prices.  Second, I have previously discussed the fact that considerable unemployment and under-employment in the labour market persists, which will cap wages, already growing at their slowest rate in the private sector for over a decade.  Third, the ratio of household debt to GDP in Australia remains high by global standards.  But this metric does not take into account the asset side of the household sector balance sheet.  Moreover, the ratio can be misleading because households consume out of their permanent income, not their current income. 

The maths of compounding suggests that even small declines in discount rates can have a powerful effect on boosting the present value of the household sector's human capital.  As this dynamic unfolds, households should gradually focus less on balance sheet repair and lift borrowing as their permanent income lifts.  A less cautious consumer is the key ingredient to a lift in revenue growth, revival in the corporate sector's entrepreneurial risk taking and a recovery in non-mining business investment.

Investment recommendation: Neutralise under-weight bets in discretionary retailers

After what has been a lost decade for the discretionary retailers, I believe that investors should now be starting to neutralise under-weight bets in the sector and gradually move overweight as more evidence of a less cautious consumer emerges.  Stock selection will be less important than getting the sector call right.  Nonetheless, a number of stocks stand out.  Based on a perpetuity earnings growth model, the following stocks offer the strongest upside: Echo Entertainment Group, GUD, Harvey Norman, Premier Investment, Retail Food Group and Super Retail Group.   

Despite the structural challenges facing department stores, there is some scope for catch-up for department store sales, suggesting upside risk to Myers.  See the table below for the full list of stocks.  Although some of the business models in addition to Myer face structural challenges, I believe that the market is under-estimating the powerful macro tailwind that a lift in the household sector's permanent income and present value of human capital will provide to the sector.


A new narrative for the Australian dollar (Update)

Two months ago, Evidente published a detailed report which suggested that contrary to the RBA's view that the currency remained over-valued, the Australian dollar was trading modestly below fair value of  80 US cents.  After what had been a strong period of out-performance from US dollar earners, I concluded that without the tailwind of A$ over-valuation - which prevailed through most of 2014 - their returns in the near term would be capped.  In this post, I provide an update of Evidente's A$ model and show that recent currency appreciation has been associated with under-performance from US$ earners.

Since the publication of the report on March 20th, the Australian dollar has confounded the expectations of futures markets, most market economists and the RBA, appreciating by around 3% against the US dollar.  The RBA's communications have become even more pointed about the persistently high A$.  In the statement accompanying the recent decision to cut the official interest rate by 25 basis points to 2%, the RBA Governor said that 'further depreciation seems both likely and necessary, particularly given the significant declines in key commodity prices.'  The A$ has not followed the RBA script, depreciating against the US$ by only 30% from the peak in global commodity prices in 2011, well below the 50% fall in the RBA's Commodity Price Index (in US$ terms). 

Mr Stevens is right to highlight that the A$ deprecation has been modest compared to the decline in commodity prices in the past four years.  But over the sweep of the post float period, the A$ typically has not moved lock in step with swings in commodity prices.  For instance, the appreciation through the mid-2000s was muted given the size magnitude of the upswing in commodity prices.  In the five years to mid-2008, the A$ had appreciated by 40% against the US$, but the RBA’s Commodity Price index more than tripled in US$ terms over this period (see chart).  During this time, the RBA did not acknowledge publicly that the A$ remained substantially below its fundamental value.

Despite the modest lift in commodity prices in recent months, and the further easing of monetary policy in Australia in early May, Evidente's econometric model of the A$ points to fair value of around 79-80 US cents.   The key innovation of the model is that it utilises an interest rate differential variable based on a negative or shadow Federal Funds rate, developed by Leo Krippner at the RBNZ.  The modest under-valuation that prevailed at the time of publication of the original report has now dissipated and the A$ is trading in line with fair value (see chart).

After what had been an extraordinarily strong period of returns from US$ earners in the six months to April, the renewed A$ appreciation has been associated with under-performance from this basket in recent months (see chart). 

The table below provides the list of big-cap US dollar earners.  The basket is trading on a median 12 mth forward PE of 20x, which represents a 25% premium to the median estimate for the ASX100 and is slightly higher than historical norms.  The basket trades on a premium because offshore earners exhibit significantly higher long-term growth expectations and lower betas than the broader market.  Their low betas arise from the predominantly defensive nature of their cash flows and business models.  The three stocks that suffer from the highest level of analyst bearishness remain Cochlear, Treasury Wine Estates and Westfield, which each attract less than 20% of buy recommendations from sell-side analysts.


Lifting the lid on the Sage of Omaha's investment secrets

More than 40,000 people undertook the pilgrimage to Nebraska to attend Berkshire’s Hathaway’s AGM on May 2nd.  They had good reason to listen to the insights of Chairman, Warren Buffett, considered by many to be the greatest investor of modern times.  Berkshire Hathaway, the company he founded almost fifty years ago, has delivered to shareholders compound annual growth in returns of over 20 per cent over this time, handsomely beating the S&P500.

Some have taken Mr Buffett’s stellar track record as compelling evidence that active management can deliver consistently high returns over the long run.  Others attribute his success to luck; by chance, a small handful of funds will inevitably beat the benchmark over an extended period. 

Researchers at AQR Capital, a US based hedge fund, have recently sought to understand the reasons for Berkshire Hathaway’s strong performance.  In their working paper, Buffett’s Alpha, Andrea Frazinni and his co-authors attribute the strong returns not to luck, but to reward for leveraged exposure to safe, quality stocks that are cheap.

Modern portfolio theory says that a stocks’ beta dictates its expected future returns.  This means that a high beta stock should yield high expected returns because it is very sensitive to fluctuations in the economic cycle.  For instance, mining firms, building material stocks and discretionary retailers are considered to have high betas since their profitability is largely tied to the fortunes of the economy.  According to theory, these sectors should yield higher returns than low beta or defensive sectors such as healthcare, consumer staples and telecommunications.

Investors with a strong risk appetite can juice up their portfolio returns by choosing to invest in predominantly high beta stocks.  Alternatively, leverage can also play an important role by allowing investors to amplify their returns.  Investors wanting to take on more risk can borrow and use the proceeds to gear up their exposure to the market.  Many retail investors engaged in this type of behaviour through margin lending for instance, during the credit boom in the lead up to 2008.

Contrary to theory, the overwhelming evidence compiled over the past three decades - led by Nobel prize winning economist Eugene Fama - has shown that high beta stocks have yielded worse returns than low beta stocks. Moreover, the assumption surrounding leverage comes unstuck in the real world.  Despite the rapid growth of hedge funds in recent decades, the lion's share of financial assets is still managed by institutional investors who are subject to leverage constraints; their mandates typically prevent them from borrowing or short-selling.

Betting against beta

In an environment where most institutional funds are subject to borrowing constraints, the obvious way to beat one’s peers is to gravitate towards high beta or risky stocks, especially those with supposedly strong growth prospects that easily capture investors’ imagination.  But crucially, these stocks become over-bought and expensive, and many fail to deliver on analysts' wildly optimistic growth expectations, which underpin their poor future returns.  Some high profile examples that fit this picture in Australia recently include: Woolworths, REA Group and Navitas.

Accounting for the tendency for high quality, defensive and cheap stocks to out-perform accounts for much of Mr Buffett’s performance over time.  Mr Buffett clearly identified many years ago that the ability and willingness to borrow heavily and bet against beta would yield remarkably strong returns.  The authors conclude that that the Sage of Omaha’s performance is not attributable to luck or chance, but rather the successful implementation of exposure to value and quality factors that have yielded strong returns over time.

Applying Buffett's Investing Principles to Australia

I have developed a number of screens for the ASX200 that represents proxies for Mr Buffett’s three preferred attributes: quality, safety and value.  Stocks need to attain a score better than the median across each of the categories to get into the long portfolio.  Three stocks that meet the criteria include: CSR, Echo Entertainment Group and IAG.  The full text report contains a full list of the thirteen stocks in the long portfolio and how they score across the quality, safety and value screens. 

Conversely, the short portfolio is composed of stocks that fail to meet the threshold across each of the three screens.  Three stocks in the short portfolio include: Oil Search, Premier Investment and Caltex.  The full text report contains a full list of the eleven stocks in the short portfolio.


A rate cut today, but what of tomorrow?

"Relevant considerations of late include the fact that output is below conventional estimates of ‘potential’, aggregate demand still seems on the soft side as resources investment falls sharply, and unemployment is elevated and above most estimates of ‘natural rates’ or ‘NAIRUs’. And inflation is forecast to be consistent with the 2–3 per cent target. So interest rates should be quite accommodative and the question of whether they should be reduced further has to be on the table." 

 - Glenn Stevens, RBA Governor, 21st April 2015

More policy easing appears to be imminent.  Interbank futures suggest there is a 70% probability of a 25 basis point rate cut at today's RBA Board meeting, while the overwhelming majority of market economists expect the RBA to ease policy today.

In December last year, in an interview to Fairfax journalists, Mr Stevens appeared to subtly acknowledge the case for more accommodative policy and laid the groundwork for a new communications strategy based on a positive narrative.  The RBA would want to avoid any further rate cuts being seen to reflect a weak economy, at a time when household and business confidence were (and still are) fragile.  Mr Stevens also indicated that the precipitous fall in energy prices would reduce inflation.

I believed that the benign inflation environment provided a cue for the RBA's positive narrative (see Evidente blog post, Money's too tight to mention, 12th December 2014) and expected that the RBA would ease policy at the February and May meetings, immediately following the release of quarterly CPI data (Australia is unique globally in having a quarterly CPI; most countries have monthly CPI readings).  The CPI release from last week confirmed that underlying inflation remains in the lower part of the RBA's 2-3% target range and that the inflation outlook does not pose an obstacle to lower interest rates.

The RBA's communications suggest that it is carefully calibrating monetary policy in the context of its policy of least regret, which assesses the likelihood and size of costs associated with making a policy error.  Most market economists, central bankers, prudential regulators and analysts are based in Sydney and Melbourne, where capital growth in housing has been strongest of late.  Moreover, the recent memory of sharp falls in house prices and the contagion effects across the United States, Europe and China is clearly influencing the RBA's cautious approach.  In seeking to contain the risks of speculative activity in housing, Mr Stevens is clearly wanting to avoid similar policy errors that he believes contributed to the credit boom and bust. 

But the RBA is also keen to contain the costs associated with growing unemployment and under-employment.  In a recent blog post (Beware of bubble talk for now - Part II, April 29th), I show that there is considerable slack in Australia's labour market: the unemployment rate of 6.1% is high amongst a group of developed countries, unemployment has remained above 6% for ten months, the longest stretch since 2003, the duration of unemployment has increased to a decade high, and the participation rate and employment to population remain low, which point to a strong discouraged worker effect.

It is telling that In the latest monetary policy minutes from April, the RBA acknowledges that labour market conditions are likely to remain subdued and that the economy is expected to operate with a degree of spare capacity for some time.  In the minds of the RBA, the more serious policy error at this juncture appears to be keeping policy unchanged.  Against this backdrop, market participants will need to become accustomed to more noise from the RBA and APRA about the use of macro-prudential to contain risks stemming from housing.  In terms of timing, the Board members also saw benefits in waiting for more data, including on inflation.

In the likely event that the central bank cuts the Overnight Cash Rate today to 2%, investors' focus will inevitably shift to what next?  Due the RBA's concerns about housing, I expect that the policy rate will remain on hold for the remainder of the year, because the central bank will want time to assess the impact of the two rate cuts.  My expectation is that the statement accompanying today's decision will therefore likely quell expectations of another rate cut in the near term, which will provide some support to the Australian dollar.

An open letter to Woolworths CEO, Grant O'Brien

Dear Mr O'Brien,

After what has been a difficult period for Woolworths - which has seen the market de-rate the stock following the recent downgrade to FY15 NPAT guidance -  a lot clearly rides on the upcoming investor strategy day on May 6th.  You have drawn attention to subdued trading conditions in Food & Liquor, evident from as early as August last year, and confirmed by the marked slowdown in sales growth in the supermarket and petrol divisions for the latest calendar year (see chart).

You have also highlighted that General Merchandise continues to be affected adversely by the Big W business transformation, hotel earnings have been impacted by the additional Victorian gaming tax, while the expected timing of break-even for the Masters rollout continues to be pushed back.

The market's verdict in the past six months has been unequivocal; the price of Woolworths shares have declined by 10-15%, while the market has risen by around 5%.  Over the sweep of the past four years -  which coincides with your tenure as CEO - the performance of Woolworths shares broadly tracked those of Wesfarmers up until six months ago, at which point your shares have strongly underperformed not just Wesfarmers but also the ASX100 ex-financials and resources (the peer group which is used to benchmark hurdle rates for your senior executives' Long Term Incentives) - see chart.  Unless you can turn around expectations at the strategy day and the remaining two months of the financial year, Woolworths is set to miss the threshold for the Total Shareholder Return hurdle rate for the second year running (but more on remuneration later).

Even against a peer group of large global food & grocery retailers, Woolworths has been amongst the group of stocks that has delivered negative excess returns or alpha in the past four years (see chart).

The significant downgrade to analysts' EPS forecasts that has occurred in recent months largely reflects a re-assessment of Woolworths' ROE prospects.  Analysts are now projecting the company to achieve an ROE of below 22% twelve months ahead, well below the 25% they had projected as recently as in October last year (see chart).  This continues a trend of deteriorating ROE prospects that date back to 2011, when brokers were forecasting Woolworths to deliver an ROE of over 30%.

The deterioration in the marginal ROE from 2011 coincides with the rollout of the Masters Home Improvement stores, to the point where the marginal ROE has recently turned negative (see chart). 

In 2011, the proposed expansion into home improvement would have seemed a sensible strategy.  Wesfarmers had demonstrated an ability to successfully manage hardware stores and supermarkets, while the free cash flows generated from Woolworths supermarkets would effectively fund the roll-out of the Masters stores.

But the expansion into home improvement has clearly pulled down the profitability of the broader group and has distracted your (and other senior executives') attention from Woolworths' core supermarkets business, which has probably contributed to the marked slowdown in sales growth from that segment in the past year.  Moreover, few in 2011 expected investors to develop an insatiable appetite for income, that would see many companies defer or abandon growth options completely to cater to this growing demand for dividends. 

At a time when Australia's corporate sector is undergoing a demerger wave, spinning off non-core business assets, Woolworths has bucked the trend towards corporate focus by expanding organically into home improvement, where the synergies between running supermarkets and hardware stores are questionable (despite Wesfarmers' success in managing Coles and Bunnings). 

Drawing on international evidence, few of the largest globally food & grocery retailers run hardware stores.  Evidente's proprietary index of corporate focus shows that Wesfarmers and Woolworths are among the least focussed food & grocery retailers globally (see chart).  Corporate focus is but one of a number of factors that govern performance; indeed focussed firms like Tesco and Sainsbury have delivered dreadful returns in recent years.  Nonetheless, the missteps associated with the Masters rollout, deterioration in group profitability and ongoing adverse impact of the business transformation of Big W are clearly distracting you and senior management from Woolworths' core supermarket business.

Structure of financial incentives helps to ameliorate agency costs

Having read the Woolworths remuneration report in detail, as well as those of your peers both in Australia and globally, the key hurdle rates contained in the Short Term and Long Term incentives appear to be reasonable.  Contrary to conventional wisdom, I do not believe that the sales targets that form part of the STIs have unduly distorted executives' behaviour to chase sales at the expense of profitability.  Among the STIs, the hurdle rate at the group level is NPAT growth, while the divisional hurdles include not just sales, but also profit, return on funds employed and cost of doing business.

If I was to quibble about the remuneration structure, it would be the gradual lowering of the EPS growth hurdles in recent years that form part of the LTIs, from 10%-15% in F09-F11 to 6%-8%.  But this is not unique to Woolworths; other companies have also lowered their EPS growth hurdles in the face of persistent revenue headwinds in recent years.

license to operate not to be taken for granted

You would no doubt be aware of the Four Corners program (Slaving Away) that went to air on May 5th, which showed damning evidence of exploitation of migrant workers in Australia's fresh food supply chain.  The allegations affect most of Australia's stores that sell fresh produce to the public, including Woolworths, Coles, Aldi, IGA and others.  Four Corners has posted to its website the written responses from each of these businesses, including Woolworths.  Although each of the supermarket chains deals with hundreds, possibly thousands of suppliers, the big supermarket chains need to be careful about managing their reputational risk, particularly as the community and governments have effectively conferred a license to operate to Woolworth, Coles and other supermarkets.  The sheer size of Woolworths and Coles suggest that they have more to gain from leading the charge and ensuring that their suppliers do not engage in worker exploitation.  Thus any detail at the investor strategy day around your proposed pipeline of cost savings in excess of $500 million and expected impact on suppliers will need to be carefully communicated and managed.

corporate focus will be rewarded

I believe that investors will reward Woolworths if at the investor strategy day you articulate a vision and future for the company that has a renewed focus on its core business of supermarkets.  You have previously demonstrated an ability and willingness to sell under-performing non-core businesses such as Dick Smith.  Perhaps your greatest legacy to the company you have worked at since a teenager will be to have the courage to admit to past failures and exit home improvement, while re-assessing the synergies that exist between general merchandise and supermarkets.   


Beware of bubble talk, for now (Part II)

In last week’s blog post, I discussed a wide ranging speech delivered by the RBA Governor in New York on April 21st (The world economy and Australia), in which he acknowledged that corporate Australia’s capital restraint of recent years reflected in part the fact that the cost of capital or hurdle rates used in capital budgeting decisions had remained sticky.  Despite the reduction in rates of return available on safe assets in Australia and globally, there has been an offsetting rise in the expected equity risk premium.  Sovereign bond yields globally have declined to record lows precisely because investors expect to be compensated more for taking on stock risk.

At times in the past year, having bemoaned the absence of entrepreneurial risk taking in Australia and implored businesses to invest for future growth, Mr Glenn Stevens’ comments provide the clearest indication yet that the RBA understands that animal spirits will be dormant for as long as the risk premium remains high.  The central bank's conduct of monetary policy over the course of this extended easing cycle suggests that it continues to under-estimate the power of monetary policy to influence the psychology of risk taking.  I concluded in last week's post that the risk premium would remain high and that multiples on low beta or defensive securities would remain elevated for as long as the capital discipline remains pervasive across corporate Australia.

A recurring question from portfolio managers that I spoke to last week related to the 'when' and 'what'; when will entrepreneurial risk appetite return and what range of indicators represent an accurate barometer of the risk premium?  I believe that the labour market provides fertile ground because new cost discipline has extended to a reluctance by businesses to hire in recent years.  Further, the labour force survey is a higher frequency and more up to date indicator than the capex survey compiled by the Australian Bureau of Statistics. 

The market understands the significance of labour market conditions at least for monetary policy deliberations; the implied probability of a rate cut at the RBA's May board meeting declined to 55% from over 75% immediately following the release of stronger than expected March employment data in mid-April (see chart).

But investors might have been premature in discounting the chances of another rate cut because a range of indicators point to still considerable slack in the labour market.  The persistent weakness in labour market conditions provides compelling evidence that the corporate sector's animal spirits remain dormant.

Record low wages growth

Growth in private sector wages has been moderated for over three years now, and the current annual rate of 2½% represents the slowest pace of growth on record, confirming that demand for labour remains subdued (see chart).

Strong discouraged worker effect, particularly among young people

The participation rate has stabilised at between 64½% and 65% in the past two years, but this remains at its lowest level since 2006 (see chart).  The low participation rate points to weak cyclical conditions which  discourage people from seeking jobs, and also reflects the demographics of ageing because older people typically have low rates of labour force participation.  The decade low level in the ratio of employment to working age population confirms that cyclical weakness in labour market conditions.

The discouraged worker effect seems to have been especially strong among young people (those between the ages of 15 and 24).  The participation rate among young people declined to a record low of 66% in 2014, down from 71% in 2008 (see chart).  Professor Jeff Borland, a labour market economist at the University of Melbourne, draws attention to the fact that the labour market for young people is particularly sensitive to cyclical conditions.  The number of young people looking for work tends to drop sharply during a downturn because hiring rates typically decline and young people account for a disproportionately high share of new hires.  Early signs of a revival in job prospects among young people have emerged in the past six months, although the participation rate of 67% remains low by historical standards.

Downward trend in average hours worked

Total hours worked has continued to grow, assisted by strong population growth, but average hours worked has been roughly stagnant now for two years and remains well below its level in 2006 (see chart).

Hiring intentions remain subdued

Forward looking measures of labour market conditions remain weak.  Both the level of job ads and job vacancies are below 1.3% of the labour force, suggesting that businesses remain cautious in their hiring intentions (see chart). 

Australia's unemployment rate is high by international standards

Australia's unemployment rate has remained above 6% for ten consecutive months, the longest stretch since 2003 (see chart).  In fact, the unemployment rate in Australia of 6.1% remains well above that of the United Kingdom, Japan, United States and New Zealand (see chart).

Unemployment duration continues to grow

People unemployed for more than 52 weeks has climbed to almost one-quarter of the total pool of unemployed, which represents the highest level since inception of the long-term unemployment ratio in 2001 (see chart).

BubbleTalk-LongTermUnemployed.jpg

The financial crisis and greater job insecurity

The Westpac/Melbourne Institute survey of unemployment expectations has increased by around 50% in the past four years to a level well above historical norms, confirming that one of the key legacies of the financial crisis is a heighted level of job anxiety (see chart).  Greater job insecurity might help to explain why households are saving the biggest slice of their incomes since the late 1980s and why the much anticipated re-bound in discretionary retail spending is yet to materialise.

THE RENEWED COST DISCPILINE: GOOD NEWS FOR SHAREHOLDERS, BAD NEWS FOR WORKERS

The persistent weakness in labour market conditions and renewed cost discipline are consistent with anecdotal evidence that the ASX200 companies continue to trim costs aggressively.  Hills Industries has announced that it 'continues to accelerate efforts to reduce group overheads and drive further structural efficiencies in its core business' , Woolworths has committed to a pipeline of cost savings in excess of $500m in its Australian Supermarkets division, and Myer has announced a strategic review under the leadership of its new CEO and is no longer proceeding with a store opening originally planned for Greenhills in NSW.

Anaemic revenue conditions continue to shape the corporate environment and the relentless focus on cost discipline.  The chart below illustrates the powerful revenue headwinds that corporate Australia has faced; forecast revenues from the ASX200 companies is at the same level that prevailed four years ago, at the peak of Australia's terms of trade boom.  Listed companies will therefore continue to seek ways to restructure, trim costs, and lift productivity to  boost profitability and cater to investors' insatiable appetite for income.  The fact that CEOs are focussing on the 'internals' or what they can control is a welcome development and a long way from chasing the pipedream of double digit revenue growth common to the credit boom years.

The renewed cost discipline is good news for shareholders but bad news for workers and job seekers.  Those waiting for an improvement in labour market conditions to signal a reduction in the risk premium associated with a revival in animal spirits will need to be patient, particularly as the RBA appears to be more concerned about the growing risks from speculative activity in housing than the costs of rising unemployment and under-employment. 


Beware of bubble talk, for now

In a wide ranging speech delivered overnight in New York, Glenn Stevens, provided more colour on his prior communications in which he has bemoaned the low level of entrepreneurial risk taking across Australia's corporate sector and implored businesses to invest for future growth prospects.

I have long argued that animal spirits remain dormant in Australia (and across most of the developed world) thanks to persistent revenue headwinds and high discount rates that companies are assigning to expected future cash flows for potential new projects.  Moreover, companies continue to cater to investors' insatiable appetite for income by lifting payout ratios.

At first glance, the persistence of a high cost of capital is difficult to reconcile with the risk free rate or yields on sovereign bonds being at record lows.  But Mr Stevens has acknowledged that lower returns on safe assets have not pulled down the cost of capital because there has been an offsetting rise in the equity risk premium.  The RBA Governor argues that the stability of earnings yields in the face of declining long term interest rates implies that the risk premium has lifted, reflecting more risk being assigned to future earnings and/or lower expected growth in future earnings (see chart).  Mr Stevens also highlights anecdotal evidence of stickiness in hurdle rates used by corporate Australia.

I have previously argued that long term interest rates are low precisely because the equity risk premium has shifted up (see the blog post from 26 November 2014 - Low interest rates are here to stay but don't expect stocks to re-rate).  That is, investors have gravitated towards safe assets as they have perceived a still high level of risk in the world.  From a capital budgeting perspective, the risk free rate is low due to factors that are restraining corporate investment: low expected earnings growth and a high expected risk premium.  Consequently, stock multiples should not get an assist from a lower risk free rate given a higher ERP and lower growth prospects.

A behavioural perspective on the risk premium and cost of capital

The common misconception that record low interest rates should be associated with a re-rating of stocks stems from the availability heuristic that is a cornerstone of behavioural finance.  Events that are memorable, directly observable and have a high valency are more likely to resonate with us.  The risk free rate is directly observable on a daily basis, so our familiarity with low long term interest rates informs our mental framing of the cost of capital.  But the equity risk premium is not directly observable, and so we are likely to neglect it as a source of variation in the cost of capital.  Just because the ERP cannot be directly observed, does not mean that it should be ignored.  

In fact, from the perspective of monetary policy, the ERP is a key channel in which a central bank can influence the psychology of risk taking.  If a central bank is seeking to revive animal spirits in the corporate sector, it must do so by reducing the expected equity risk premium (as well as lifting expectations of revenue growth).

If the lift in the risk premium has broadly offset lower returns on safe assets, then the effect on the multiple of the market ought to be neutral.  But this masks important sources of cross variation between high and low beta stocks.  High beta stocks are associated with greater sensitivity of their cost of capital to shifts in the risk premium.  For instance, a lift in the risk premium from 4% to 5% causes a high beta stock's cost of equity to rise by 150 basis points, while the cost of capital for a low beta stock rises by less than 50 basis points (see chart). 

While not shown here, mathematically, the percentage increase in the multiple of a high beta stock exceeds that of a low beta stock in an environment where the risk premium is rising, other things being equal.  Moreover, it is reasonable to think that low beta stocks have experienced a larger compression of their betas in recent years than their high beta counterparts, as investors have assigned lower risk to the future earnings of defensive stocks. 

Indeed, the pattern confirms that the defensive sectors in the Australian market are trading at a premium (based on dividend multiples) to their 10 year median estimates, while cyclical sectors are trading at or below their historical medians (see chart).  While lower expected earnings growth has contributed to this trend, we believe that the higher equity risk premium has played an important role in driving a wedge in the multiples between high and low beta stocks.

Beware of bubble talk, for now

It might be tempting to think that either defensive stocks or high yielding stocks with strong and sustainable sources of competitive advantage are exhibiting bubble like valuations.  But shifts in the risk premium and cost of capital matter for portfolio construction, and our analysis suggests that they have contributed to the relative rise in valuations for low beta or defensive stocks.  I expect those high valuations to persist while the corporate sector's animal spirits remain dormant.  The unwinding of the defensive trade will eventually happen abruptly, but that remains way off as long as output remains below potential, there is deficient aggregate demand, unemployment is well above the natural rate, and inflation remains subdued.


Who's Afraid of Deflation?

Concerns about deflation - the phenomenon of falling prices of goods and services - in the wake of the financial crisis, have provided the intellectual cornerstone for central banks around the world - led by the Federal Reserve - to embrace unconventional policy measures, notably forward guidance and large scale asset purchases or quantitative easing.

The deflation aversion has greatly influenced policymakers in the United States, thanks to the legacy of the Great Depression and the fact that the former Governor of the Federal Reserve, Ben Bernanke, remains a leading authority on this episode.  Most economic historians attribute the depth and long duration of the Great Depression to excessively tight monetary policy pursued by the newly formed Federal Reserve at the time.  More recently, central bankers have also been keen to avoid the decade long deflation that has afflicted Japan.

The Bank of International Settlements has recently examined the historical record of deflation and output growth (The costs of deflation: A historical perspective).  The analysis is based on a newly developed dataset of 38 economies covering 140 years.  Their key findings are as follows.

1. There is only a very weak link between deflation of goods and services and growth in output.  On face value, the finding suggests that deflation is not particularly costly.

2. There is a stronger link between asset price deflations - particularly falling property prices - and output growth.

3. The modern day pre-occupation with deflation stems from the Great Depression, where deflation was associated with significant output losses.

4. Japan's deflation in recent decades might reflect the rapid ageing of the country's population.  When controlling for the demographics of ageing, Japan's economic performance has been comparable to the United States since the turn of the century. 

5. The BIS study concludes that policy makers should not necessarily be afraid of deflation in goods and services, but should be vigilant in monitoring and responding to asset price deflation, particularly persistent declines in property prices.

Based on a simple demand-supply framework, it is self-evident that not all deflationary episodes are pernicious.  Falling prices of goods and services can reflect a demand shock, a supply shock or a combination of the two.  The diagram below show that bad deflation is associated with lower demand (ie. lower prices and output), while good deflation is associated with a positive supply shock (ie. lower prices and higher output).  Bad deflation is contractionary while good deflation is expansionary.  This framework downplays the causal role of deflation; rather, it interprets deflationary episodes as symptomatic of unexpected shifts in demand and supply.

A positive supply side shock might reflects factors which lift a country's productivity growth or supply of inputs, such as innovation, technological change and permanent tax cuts which induce greater workforce participation.  The results of the BIS study - that goods and services deflation does not appear to be costly on average over the sweep of the past 140 years - suggests that positive supply side shocks have played an important role in underpinning deflationary episodes in the past. 

With the exception of Japan, few countries have experienced persistent deflation in recent decades.  But many countries have undergone a period of disinflation in goods and services - a moderation in the rate of price growth - since the financial crisis.  During this time, prices of goods and services in advanced economies have expanded at a compound annual rate of well below 2% compared to growth of 2-3% during the credit boom (see chart). 

The Great Disinflation - A Demand Contraction

The fact that growth in real GDP has also slowed markedly since the financial crisis confirms that a contraction in demand has underpinned the Great Disinflation.  Moreover, house prices remain below their prior peak in the United States and many advanced economies which offers compelling evidence of an adverse and persistent demand shock (see chart).  The finding of the BIS study that property price deflations have historically been associated with significantly weaker output growth probably reflects the fact that lower house prices undermine aggregate demand by reducing wealth and collateral values.  Thus falling house prices combined with deflation or disinflation of goods and services represents a clear signal of an adverse demand shock that central banks should remain vigilant towards.

Contrary to the conclusions of the BIS study, I am sceptical that Japan's rapidly ageing population has caused or contributed to its persistent deflation in recent decades.  It is widely accepted that ageing is associated with a negative demand shock which other things being equal, should be deflationary.  But a smaller working age population is also associated with a contraction in supply, which should be inflationary.  In my view, Japan's deflation stems from a shortfall in aggregate demand related to the tight stance of monetary policy (up until recently) and an unwillingness of successive governments to let zombie banks die.  The more aggressive stimulus adopted by the Bank of Japan under its new Governor is therefore a welcome development.

Revival of animal spirits crucial to the outlook

Central banks have been justified in resorting to unconventional policy measures to address growing deflationary risks associated with the shortfall in aggregate demand since the financial crisis.  The series of synchronised policy easings by many of the world's central banks through January and February should be viewed through this prism.  For too long since the financial crisis, some central bankers and many commentators have under-estimated the power of monetary policy.  Even if the equilibrium global interest rate has declined - as argued by Ben Bernanke in his recent blog post - monetary policy still has an important role to play in boosting the psychology of risk taking in the corporate and household sectors.  

US employment growth moderates, buying the Fed and growth investors more time

The March non-farm payrolls release confirmed that employment in the United States continues to expand but at a more moderate pace over the past three months.  The US economy added a net 600k jobs in the March quarter down from 970k jobs in the December quarter (see chart). The unemployment rate remained steady at 5.5%, well below it peak of 10% and its lowest level in six years. 

The decline in the labour force participation rate - the percentage of the civilian population either in employment or actively looking for work - from a peak of over 66% in 2007 to its current level of  63% - has assisted the fall in the unemployment rate.   An understanding of the mechanics of the unemployment rate helps to shed light on how lower workforce participation has contributed to a lower unemployment rate (see graphic). 

Assuming a participation rate  of 66% - the average of the credit boom - translates into a counterfactual unemployment rate of over 10%.  Of course, this scenario assumes that total employment remains unchanged from its current level of 148.3 million, which is unrealistic because greater labour force participation would be associated with stronger labour market conditions and higher employment.  This does not invalidate the counterfactual exercise, but does highlight just how sensitive the unemployment rate is to changes in the participation rate.

How much of the post-2007 decline in the participation rate is structural is important to gauge the amount of slack in the US labour market and the future course of monetary policy.  The ageing of the baby boom generation has helped to underpin lower workforce participation, because older people have lower participation rates than prime age workers (see chart).  A recently published IMF study suggests that at least half of the three percentage rise in the participation rate post-2007 is irreversible, thanks mainly to the demographics of ageing.  

A participation rate of 64.5% for instance, produces an unemployment rate of 8%, providing further evidence that there is plenty more labour market slack than implied by the current unemployment rate of 5.5% and sheds light on why US inflation pressures remain dormant despite the decline in the unemployment rate.  The Phillips curve, which formalises the short-run inverse relationship between inflation and unemployment, has flattened considerably since the financial crisis, and confirms that core inflation has become less responsive to changes in the unemployment rate (see chart).

The flatter slope reflects 1) the fact that the unemployment rate has become a less reliable barometer for labour market conditions due to structurally lower labour force participation; and 2) inflation expectations remain well anchored.  The flatter Phillips curve suggests that further cyclical improvement in the labour market might not lead to inflation moving back towards the Federal Reserve's 2% objective, giving the central bank scope to remain patient in it approach to normalising monetary policy. 

In fact, since mid-2011, the core CPI has decelerated to an annualised rate of 1.5%, well below the Fed's target and down from 2.8% at a time when the unemployment rate has declined by over three percentage points (see chart).  So much for the prevailing conventional wisdom that the large pool of long-term unemployed would give rise to inflationary pressures at high rates of unemployment due to hysteresis effects (ie. de-skilling).

Discount rate shocks: A key risk for growth investors

Deliberations of the Federal Open Market Committee about the much anticipated timing of lift-off of the Federal Funds rate might seem far removed from the day to day decisions and portfolio returns of growth investors.  But an analysis of the performance of stocks around the taper 'tantrum' in May 2013 reveals the sensitivity of premium rated growth stocks to the future course of monetary policy.  In his testimony to Congress on 22 May 2013, Ben Bernanke flagged that he expected the Fed to start to slow or taper the pace of bond buying later in the year, conditional on continuing good economic news.  Yields on 10-year Australian Commonwealth Government Securities jumped by around 20 basis points and the ASX200 fell by 5% during that week.

The chart below reveals that premium rated growth stocks were among the worst performing stocks in the ASX200.  In fact, the four stocks that yielded the lowest returns were all high PE, high growth stocks: CTD, DMP, IIN and REA.  Many of these and the other premium rated growth stocks in the list are low beta or defensive, so the strong under-performance probably reflects the long duration attributes of high growth stocks.  The taper tantrum highlights that the implied discount rates that investors apply to the expected future cash flow of these stocks are clearly vulnerable to any sudden and unexpected increases in the risk free rate. 

Since the taper tantrum, Australian 10 year government bond yields have declined by around 100 basis points to 2.3%.  The associated fall in expectations of the risk free rate has probably been a tailwind in the out-performance of premium rated growth stocks; the list of stocks in the chart above have produced a median return of 44% since then, well above the ASX200 (30%). 

Good news for growth investors (for now)

The lesson for growth investors is that discount rate shocks represent a key risk for their portfolio performance because of the long duration attributes of growth stocks.  But the good news is this; the recent moderation of US employment growth, still considerable slack in the US labour market, and little prospect that core inflation will move back to the Fed Reserve's 2% objective anytime soon, should buy more time for not just the Fed but also growth investors.


Taxing Times

The Government release of Re:think, its tax discussion paper, is a welcome development, designed to kick-start the conversation with the community on a range of reform options designed to achieve a simpler and streamlined tax system capable of meeting the growing needs of an ageing population. 

In this post, I discuss some of the areas raised in Re:think which are of greatest interest to equity investors: how important income and consumption taxes are to Australia's tax take in a global context, the prospect of the growing drag from bracket creep on household disposable incomes (discretionary retailers), the outlook for the GST (supermarket retailers), the efficacy and viability of the dividend imputation system (high yielders with predominantly domestically oriented operations), the sustainability of the concessional tax treatment of superannuation (asset managers), and the risk associated with companies that have low effective tax rates.

The great divergence

Although Re-think does not consider the outlook for government spending, the conversation about the viability of Australia's tax system cannot be disentangled from trends in expenditures.  After growing in line with government outlays during the credit boom, tax revenue dropped sharply during the financial crisis and although it has recovered since then, it hasn't kept up with the path of government spending (see chart). 

Australia's ageing population will make it increasingly difficult for governments to reduce the growth in their spending.  The burden will thus fall on governments to reform the tax system to reduce its sensitivity to the economic cycle so that downturns are not associated with a large and persistent divergence between spending and tax revenue.  The federal Government collects around 80% of Australia's total tax revenue, mainly from taxes levied on individuals and companies, while state and territory governments collect 15% of tax revenue, largely through payroll taxes and stamp duties (see chart).

Australia's aggregate tax burden - 27% of GDP - is low by the standards of other developed economies, which reflects the overall size of government and the fact that Australia is one of the few countries that does not levy specific social security taxes.  Much of the media reaction to Re:think has been around Australia's excessive reliance on corporate and personal income tax, and what this might mean for the politically sensitive Australia's Goods & Services Tax.  Income tax levied on individuals accounts for 40% of total tax revenue and corporate taxes account for another 20%.  The combined contribution from these two sources is second only to Denmark (see chart). 

But the heavy reliance on corporate and personal income tax reflects Australia's low consumption tax take and the  fact that Australia does not levy a social security tax.  Social security contributions across the OECD represent a significant source of revenue, accounting for one quarter of tax revenue in developed countries.   Australia's consumption taxes generate around 27% of total tax revenue, below the OECD average of 32% (see chart).

The GST - Politically Hot Potato

The GST is Australia's main consumption tax which applies a rate of 10% to a range of goods and services. The rate is around half of the OECD average and the base is narrow, applying to only 47 of the consumption basket (see chart). 

The GST base has narrowed over time because Australians are increasingly spending a bigger slice of their budgets on health and education that are exempt from the GST (see chart).  Going forward, Australia's ageing population will likely further reduce the GST base.  Fresh food is also GST exempt.  Any efforts to broaden the base to capture fresh food would clearly have negative implications for food retailers Woolworths and Wesfarmers, although the effect on profitability would be partly ameliorated by government efforts to compensate low income earners.

But Re:think acknowledges that GST reform is a politically hot potato.  The Commonwealth Government collects the GST on behalf of the states and territories and all the revenue raised by the GST is provided to the states and territories.  Thus any change to the rate or base would require unanimous support of the state and territory governments.  Comments from the Prime Minister and Treasurer today confirm that any efforts to reform the GST would also be conditional on broad political consensus for change.  If the Shadow Treasurer's - Chris Bowen's - comments on the 730 Report tonight are any guide, support from the ALP is not forthcoming at this time (nor any time soon).

Bracket creep - A drag on discretionary retailers

Australia's tax system is progressive because higher marginal tax rates are levied at higher income levels.  Because the tax or income thresholds are not indexed, they remain fixed and do not keep up with inflation or wages.  So over time, income earners will find that they face higher marginal tax rates as their salaries grow beyond the tax thresholds.  This effectively leads to bracket creep which erodes the value of tax cuts.  At present, the second highest marginal rate of 37% is levied at gross incomes of $80,000 pa, while the top marginal rate of 45% applies to gross incomes above $180,000. 

Currently, average full time weekly earnings is around $75,000 which is associated with a marginal rate of 32.5% for each dollar earned above $37,000.  Based on the government's estimates, a full time employee is projected to move into the second highest tax bracket of 37% by 2016-17 (see chart).  In the absence of cuts to marginal rates or adjustments to income tax thresholds, bracket creep promises to be a drag on discretionary spending at a time when profitability for the discretionary retailers is little changed from a decade ago.

Rethink-BracketCreep.jpg

Target - Savings in superannuation?

Among saving vehicles, bank deposits attract the highest marginal tax rate followed next by foreign shares and property, while superannuation attracts the lowest tax rate because contributions are taxed at a flat concessional rate of 15% out of pre-tax income (see chart).  The flat concessional rate, when combined with the progressive income tax system, produces regressive outcomes.  That is, high income earners effectively receive the largest tax benefit from the superannuation system.  The discussion paper acknowledges the problems of distribution and fairness that the superannuation system gives rise to.

Thanks to the growing concerns of rising income inequality across many developed countries - including Australia - there is a growing risk that the tax breaks that Australia's superannuation system offers the wealthy will increasingly come under intense scrutiny, particularly from a government with little philosophical attachment to a system of forced saving.  While such changes would carry negative implications for Australian based asset managers, ironically they would be expected to be met with stiff opposition from the ALP, which was the party that launched superannuation in the early 1990s. 

But any measures designed to reduce the size and scope of superannuation tax concessions accruing to high earners and the wealthy would likely garner support from the cross benchers in the Senate.  Stocks that would be most adversely impacted are the pure play asset managers (BTT, MFG, PPT, PMC) and the major banks, all of which have significant wealth management operations.

Dividend imputation - Not in the firing line thanks to an ageing population

Any proposed changes to Australia's dividend imputation system is likely to arouse interest amongst institutional investors, particularly at a time when high yielding stocks with defensive cash flows have delivered strong performance for over three consecutive years.  The discussion paper draws attention to the costs to tax revenue associated with a full imputation system, which Australia has had in place since 1987.

But Re:think also addresses some of the key advantages of imputation.  First, it ensures that there is no double taxation of income earned by Australian shares owned by Australian resident shareholders.  Second, it supports the integrity of the business tax system because imputation does not encourage Australian companies to avoid tax; tax avoidance by Australian companies reduces their ability to pay unfranked dividends.  Third, imputation imposes an important source of discipline on CEOs since it encourages companies to pay out dividends rather than retain profits and discourages forays offshore, which have tended to be value destructive on balance over the sweep of the past three decades. 

Given the demographics of ageing, I doubt that this or any future government will tamper with the tax treatment of corporate payout that effectively encourages companies to cater to the growing influence of those approaching retirement age, and their preference for dividends over capital growth.

Regulatory risk surrounding corporate income tax set to grow

Corporate income tax is levied at a rate of 30% on all taxable income earned by companies, which is higher than the OECD average of 25% (see chart).  Re:think discusses the mobility of capital and the fact that Australia's relatively high corporate tax rate potentially deters foreign investment in Australia.

Despite the high corporate tax rate, Australian resident shareholders effectively pay a lower tax rate on their dividends than other country shareholders thanks to imputation.  Moreover, it is not entirely clear just how much of a deterrant to foreign investment is associated with Australia's high corporate tax rate.  After all, the corporate tax rate levied in the United States is amongst the highest in the OECD at close to 40%.

Indeed, there is a case for lifting the corporate tax rate.  First, after peaking at a record high of 25% during the credit boom, the corporate tax take as a share of economy wide profits has fallen to 17.5%, below its long run median (see chart).  Second, the mining boom saw a reduction in effective tax rates due to the growing depreciation and amortisation expenses associated with the construction of mining and LNG projects.  The size of this effect is already diminishing however, as mining and energy companies have increasingly deferred or permanently shelved new investment projects.  Third, the politics of growing income inequality across most developed countries - which has found a credible voice in French economist Thomas Piketty - means that a lift in the corporate tax rate is politically more feasible than other alternatives. 

Beyond a lift in the corporate tax rate, a number of companies with low effective tax rates would be exposed to measures that seek to raise the corporate tax burden, including: CGF, FXJ, QBE, COH, IPL, SEK and CSR (a full list of exposed stocks is available on request).  Infrastructure companies - some of which receive a net tax benefit due to their large depreciation and amortisation charges - should be insulated because governments are unlikely to implement reforms that discourage infrastructure investment. 


The yield trade and the RBA's easing bias: More than meets the eye

The RBA confounded market expectations and left the overnight cash rate (OCR) unchanged at 2.25% at the March meeting, but adopted an explicit easing bias which would have appeased the market somewhat.  Its reluctance to cut rates in consecutive meetings stems from its desire to have more time to assess the impact of its decision to ease policy in February. 

Clearly, it wasn't persuaded to cut again by the unambiguously weak data flow since the February meeting, including the labour force survey and capital spending intentions.

In previous posts (notably, 17th December 2014, Money's Too Tight Too Mention) I suggested that February and May represented the most likely months for policy easing because in an interview in mid-December to the Fairfax press, Glenn Stevens laid the groundwork for lower rates based on a positive narrative.  He was keen to ensure that the markets would not interpret a shift to ease policy as reflecting weak demand, at a time when business and consumer sentiment were still fragile.  A reading of the interview suggested that the slide in oil prices and low inflation would form an integral part of the RBA's positive narrative.

The case for further policy easing has been compelling for some time.  The RBA's patience with the non-mining business sector has been wearing thin for a while.  Through 2014, the RBA implored businesses to invest for growth rather than remain fixated on their costs and internals.  The new normal of capital and cost discipline embraced across the corporate sector has dampened capital spending, to the point where now that the ratio of capex to assets has declined to 1.75%, well below the historical median of 2.2% (see chart).  

The RBA had clearly under-estimated the pervasiveness of this newly entrenched discipline.  Persistent revenue headwinds, a loss of trust in ability of CEOs  to undertake value accretive investments and acquisitions, and investors' insatiable appetite for income has meant that companies increasingly are focussing on trimming operating costs, deferring capex and restructuring to boost profitability.  CEOs with a track record of acquisition led growth no longer command a premium in the market for managerial talent. 

The Agency Costs of Free Cash Flow Have Fallen Considerably

It is a welcome development for shareholders that CEOs are now focussing on what they can control  rather than chasing the pipedream of double digit revenue growth.  Shareholders are exerting a tremendous discipline on companies to return surplus cash flow and in so doing, the agency costs of free cash flow have fallen considerably.  The interim reporting season confirmed that companies continue to lift payout ratios where feasible and more are undertaking buybacks.

But the flipside of the new normal of capital and cost discipline has been sluggish growth.  The economy has effectively been stuck in a nominal recession for three years now, coinciding with the negative terms of trade shock.  The December quarter National Accounts due for release today should confirm that the terms of trade has declined by over 30% from its 2011 peak and that the nominal economy has expanded by less than 4%pa over this time, representing the weakest period of growth since the deep recession of the early 1990s. 

Inflation does not represent an obstacle to lower interest rates.  Growth in unit labour costs - productivity adjusted wages growth - remains weak, private sector nominal wages are growing at their slowest rate on record, there is little sign that the depreciation of the Australian dollar has flowed through to higher prices of tradeable goods, inflation expectations are well anchored, the slide in oil prices pose a downside risk to headline inflation, and there is still considerable slack in the labour market .

Contrary to the RBA's view, it is the role of monetary policy to revive animal spirits, which have been dormant for three years now.  Also contrary to recent statements from Mr Stevens, policy easing at lower interest rates can be just as effective at boosting expectations of growth as policy easing at higher rates.   To the best of my knowledge, there is no theoretical support for the assertion that monetary policy is less potent at lower interest rates.  Further, the large scale asset purchases and forward guidance adopted by the US Federal Reserve, Bank of Japan and other central banks since the financial crisis offers ample evidence that the zero lower bound does not render monetary policy impotent.  Mr Stevens continues to under-estimate the power of monetary policy to revive growth and reduce unemployment.

The Yield Trade: More Than Meets the Eye

Many will interpret the RBA's adoption of an explicit easing bias as a harbinger for further out-performance of high yielding stocks.  At a time when term deposit rates continue to fall, the lure of high yielding stocks - particularly those accompanied by high levels of franking - is compelling.  But on closer inspection, high yielders have endured a period of under-performance in recent years.  Since the end of 2013, the low yielders have delivered an average portfolio return of 24%, well above the ASX200 (16%) and the highest yielding stocks (6%) - see chart.

Valuation theory sheds some light on the poor performance of high yielders at a time when interest rates have declined.  A stock's dividend yield equals the expected discount rate (k) minus expected dividend growth  into perpetuity (g).  Holding g constant, valuation theory says that high yielders ought to be associated with higher risk and higher betas than low yielders.  It so happens that risk assets have fared worse than safe assets in recent years, at a time when investors have eschewed risk from their portfolios; emerging market equities for instance have underperformed and sovereign bond yields around the world have declined to record lows.  Thus, the shift towards safe assets has undermined the performance of high yielders.

Aside from what valuation theory says about the riskiness of high yielders, the pattern of price performance also suggests that investors perceive these stocks as riskier.  The average price performance over the past six months among the high yielders is -11%, well below the low yielders (+1%).  For investors seeking to invest in high yielding stocks with strong price momentum outside of the banks, utilities and REITs, only three candidates meet these criteria: CCL, IFL and JBH.  In a forthcoming report, Evidente will showcase a systematic approach for investors to measure and identify stocks with sustainably high yields.


Tame inflation data and the bond market signal that the yield trade is yet to run its course

As with most macroeconomic releases, there was something for everyone in today’s December quarter CPI.  For the doves, the precipitous fall in petrol prices has pulled down the headline CPI which is around 1.6% higher than a year ago.  For the hawks, the various measures of core or underlying inflation came in stronger than expected, growing by 0.66% in the quarter.  Nonetheless, on a year on year basis, they remain close to the bottom end of the Reserve Bank’s inflation target range of 2-3%.

For the hawks, the inflation data might not offer a compelling reason for the central bank to cut interest rates.  Unlike many other advanced economies, core inflation has not undershot the bank’s inflation target and the fall in the $A/$US cross rate will lead to inflationary pressures in tradeables in coming quarters.  The hawks would also point to concerns that the RBA Governor has expressed about further stimulus stoking speculative activity in housing.

For doves, such as Evidente, the inflation data does not pose an obstacle to further policy easing for an economy that has been stuck in a nominal recession since 2011.  Animal spirits remain dormant and labour market conditions continue to deteriorate.  Record low growth in private sector wages and households’ heightened concerns surrounding job security – which have lifted by 50% in the past three years - point to considerable slack in the labour market (see chart).

Valuations of the yield trade are not exactly stretched

The yield trade has delivered stellar returns for quite some time now.  A portfolio of high yielding stocks with strong earnings predictability or stability has produced a compound annual return of 23% in the past three years, well above the ASX200 return of 15%.  Investors who have been on the right side of the trade are understandably anxious about the prospect that it unwinds against the backdrop of a cyclical re-bound.

But my quantitative analysis suggests that valuations of the yield trade are far from stretched.  The basket is trading on a PE of 15 based on 12 month forecast earnings, which represents a 3% premium to the ASX200.  But at times over the past three years, the basket has traded at significantly higher premiums (see chart).

Record low bond yields are not a harbinger for a cyclical re-bound

Investors concerned about the prospect of a strong cyclical re-bound would be well advised to interpret what the bond market is telling us.  10 year government bond yields have fallen recently to close to a record low of 3%.  This is the lowest level since mid-2012, a period which coincided with the RBA embarking on a series of rate cuts (see chart).  Clearly, bond investors are not pinning their hopes of a strong cyclical rebound anytime soon, nor are they expecting a resurgence in inflation.

The clock ticks on the global yield trade

Given the ECB’s announcement last week to expand and extend its program of large scale asset purchases, the world’s three major central banks are now aligned in their determination to address the shortfall in aggregate demand, reduce the slack in their labour markets, and boost expectations of inflation and nominal GDP.  The clock is therefore ticking on the global yield trade.  But it will be a while before the synchronised actions from the world’s major central banks successfully revive the dormant animal spirits in the corporate and household sectors.

Key action point: For Australia, the tame CPI print, record low bond yields and the fact that valuations of high yielding stocks with strong earnings stability are not stretched, suggest that the yield trade has yet to run its course.

Further rate cuts from the RBA no saviour for domestic cyclicals

Although still in its infancy, 2015 has so far been a frenetic one for central banks around the world, in what has been a series of synchronised (but not co-ordinated) monetary easings.  Central banks in Switzerland, Denmark, Turkey, Canada and Peru have cut their official interest rates in recent weeks, and at the time of writing, the ECB is expected to extend and expand its program of quantitative easing at its meeting on January 22nd.

The Bank of Canada’s (BOC) decision on Wednesday to cut its key lending rate by 25 basis points to 0.75% has lifted investors’ expectations of a rate cut at the RBA’s February board meeting.  Interbank cash rate futures now point to a 30% probability that the RBA cuts rates by 25 bps in February, up from 20% a day earlier.

In this post, I discuss the implications of the BOC’s decision for the RBA’s policy deliberations, suggest that the RBA should reduce the cash rate to 2% by June and undertake quantitative analysis of previous easing cycles which suggests that domestic cyclicals are unlikely to benefit from rate cuts.

How shocking is the terms of trade shock?

The BOC cited the precipitous drop in the price of crude oil as the key reason behind its decision to ease policy for the first time since 2009.  As a major oil exporter – crude oil accounts for 15% of the country’s export basket – the BOC said that the negative terms of trade shock will have an adverse impact on growth in incomes, wealth, and domestic demand, and reduce inflation pressures.

The BOC highlights the multiplier effects of the lower oil price on investment in oil extraction, which accounts for 3% of GDP.  More generally, the oil and gas sector makes up almost one third of Canada’s business investment.  Against this backdrop, the central bank justified the rate cut as providing insurance against these risks materialising.

Both Canada and Australia are small open economies that are commodity exporters.  But the impact of the oil price decline on the two economies is markedly different because while Canada is a net oil exporter, Australia is a net importer of oil.  So what amounts to a negative terms of trade shock for net oil producers like Canada, is a positive shock for net consumers like Australia (albeit a smaller one).

Although crude oil accounts for 4% of Australia’s export basket, oil imports exceeded exports by $25 billion in 2014, which translates into oil trade deficit of 1.5% of GDP (see chart).  A 50% drop in the price of crude oil therefore equates to a positive terms of trade shock of 0.75% of nominal GDP.

For the RBA then, the lower oil price imparts a stimulus to  nominal GDP.  But like Canada, the lower oil price has arrived at a time when core inflation pressures have been trending lower and inflation expectations remain well anchored (see chart).

Oil, inflation and the RBA’s positive narrative

The lower oil price is not the reason why the RBA should ease policy, particularly as a lift in expected global oil production has underpinned the drop in price.  The key reasons have been present for some time.  Australia has suffered a significant negative terms of trade shock since global iron ore and coal prices peaked in 2011. 

During this time, the terms of trade has declined by around 30%, which has underpinned the fact that Australia has remained stuck in a nominal recession for three years.  In all fairness to the RBA, it cannot control commodity prices, but it could have taken a leaf out of the BOC’s playbook and cut interest rates more aggressively as insurance against growing unemployment.

The sharp decline in the oil price however, provides the RBA with a positive narrative to cut interest rates while downplaying the anaemic state of the nominal economy.  In a blog post on December 12th (Money’s too tight to mention) following an interview from the RBA Governor to the Fairfax press, I suggested that Mr Stevens had started to lay the groundwork for more policy stimulus, based on the prospect that a lower oil price would further reduce inflation pressures to below the RBA’s target range of 2-3%.

I argued that the inflation outlook therefore would form an integral part of the RBA’s positive narrative, so the most likely timing of the next rate cut would be February, a week following the release of what is likely to be a benign CPI print for the December quarter.  Expect another rate cut to follow in at the May board meeting, a week following the release of the March quarter CPI in late April.

Rate cuts no saviour for domestic cyclicals

I have undertaken a quantitative analysis of the performance of domestic cyclicals based on the current easing cycle stretching back to late 2011.  Specifically, I track the performance of the media, building materials and discretionary retail sectors around the two last episodes of rate cuts in late 2011 and through most of 2012/13.  Rather than benchmark against the performance of the market, I benchmark domestic cyclicals against domestic defensives (split out into banks and non-bank defensives).

Domestic cyclicals did not outperform in late 2011, at a time when the central bank cut interest rates by a cumulative 50 basis points.  In fact, the domestic defensives outperformed strongly during that time.  The returns of domestic cyclicals in the second period of policy easing in 2012/13 was mixed. Discretionary retail performed strongly, but both media and building materials underperformed the banks and non-bank domestic defensives (charts are available on request).

The chart below shows the performance of domestic cyclicals in recent months, as the market has gradually factored in another rate cut by May 2015.  The performance of interest sensitive sectors has been mixed, with building materials flying, but discretionary retail and media lagging.

The key caveat to the empirical findings is that the analysis is based only on two episodes of rate cuts in the current easing cycle, and thus is vulnerable to the charge of mindless data mining.  But I believe the way the RBA has conducted monetary policy this cycle is markedly different to past cycles.

And therein lies the answer to the puzzle of why interest-sensitive sectors haven’t performed better around RBA rate cuts in the current easing cycle. Perhaps paradoxically, most of the potency of monetary policy lies in the expectations the central bank creates about future monetary policy; and in this cycle the RBA has been far more ambivalent about stimulating growth than it has been in previous cycles.

This has manifested both in terms of the quantum and timing of rate cuts, and in the RBA's language.  The RBA's timidity reflects its concerns around moral hazard, stoking a bubble in property and rapid growth in investor housing lending. Accordingly, rate cuts to date have had little effect in reviving animal spirits in the corporate and household sectors.

To the extent that further rate cuts are associated with the RBA reminding investors of those concerns, this will blunt the announcement effect on interest sensitive sectors, and will do little to revive entrepreneurial risk taking.  Perhaps this time is different; after all, the prospect of rate cuts in Australia is occurring against the backdrop of synchronised monetary easing globally.  But my bet is that this time won’t be different.

Key action point

If the RBA cuts rates twice in 1H15 (as I expect it will in February and May, immediately after the 4q and 1q CPI prints to promote a positive narrative for policy easing), no need to be overweight domestic cyclicals.

The IMF's Patience with the ECB wears thin

Policy makers – particularly those that transcend national borders – normally ensure that they are singing from the same hymn sheet.  But the updated World Economic Outlook (WEO) reveals that the IMF is (rightly) fed up with the ECB’s timid approach to monetary policy.

The IMF argues that monetary policy in the euro area remains slow to respond to the persistent decline in inflation and as a result, the region is vulnerable to any shock that leads to further disinflation or outright deflation.  The IMF urges the ECB to take heed of market expectations, arguing that financial markets are already broadly anticipating further monetary policy (at the forthcoming ECB meeting on 22 January).

The IMF’s frustration with the ECB is understandable because it expects euro area to remain anaemic, growing by a paltry 1.2% and 1.4% in 2015 and 2016, revised down by around 25 basis points from the last WEO update in October 2014.  This on the heels of the euro area expanding by only 0.8% in 2014.

The New Mediocrity and Dormant Animal Spirits

More generally, the IMF appears to have adopted the Larry Summers ‘secular stagnation’ view of the post crisis global economy, which it describes as the ‘new mediocrity.’  This view draws heavily on the Reinhart/Rogoff interpretation of history which shows that recoveries from balance sheet recessions are structural and therefore painfully slow.

The IMF lends support to this view by arguing that the downgrade to the global growth outlook primarily reflects dormant animal spirits;  ‘investment weakness as adjustment to diminished expectations about medium term growth prospects’ and highlights the downside risks to prospective potential output.  In terms of the numbers, the IMF expects the world economy to expand by 3.5% and 3.7% in 2015 and 2016, around 30 basis points lower than in October 2014.

But the IMF’s significant lift to the growth outlook for the US (to 3.6% and 3.3% for 2015 and 2016) should provide a reminder that cyclical factors have played an important role in the slow post-crisis recovery.  Since 2012, the US Federal Reserve has been arguably the most aggressive central bank in its conduct of forward guidance and quantitative easing, an approach which has clearly been informed by the policy errors committed around the Great Depression and recession in 1937.

The divergent growth paths of the United States and euro area in recent years should help to dispel the myth that the monetary policy is ineffective at the zero lower bound.  The counterfactual of tighter monetary policy in the United States would surely have been associated with higher and rising unemployment and slower growth, which the euro area has experienced.

Encouragingly, the IMF endorses the aggressive conduct of monetary policy to reduce the still large output gaps in most economies.  It argues that central banks must remain alert to the possibility that further disinflation does not lead to an additional drop in inflation expectations.  This would surely be a positive for most asset classes thanks to an abundant supply of liquidity.

Please Curb Your Enthusiasm...

The IMF is not alone in downgrading the outlook.  Like many economic forecasters, it has under-estimated the lingering effect of the financial crisis and the timid responses from many central banks.  But the IMF has tended to be too optimistic over the sweep of the past two decades; it has persistently over-estimated world growth over two thirds of the time (a chart is available on request).

Unlike sector analysts who are incentivised to offer excessively optimistic forecasts of company profitability to curry favour with management and garner corporate banking business, it is a puzzle that the IMF’s forecasts have exhibited excessive optimism. 

...but China's Outlook Is Too Pessimistic 

But its forecasts for China look unusually downbeat.  It has downgraded China’s growth to 6.8% and 6.3% in 2015 and 2016, citing the greater willingness of authorities to address the vulnerabilities associated with rapid growth in credit and investment of recent years.  But growth of sub-7% appears to be at odds with the history of growth for a number of Asian economies over the past half century, at a comparable level of China’s development today. 

My yet to be published analysis suggests that growth in GDP per capita of 7.5% is sustainable over the next two decades, underpinned by catch-up as it continues to borrow from already developed technologies and know-how.

Investment Implications - Overweight Safety

As long as the IMF and other economic forecasters continue to downgrade expectations of global growth, investors should be overweight safe assets and defensive sectors within stock markets, particularly companies that offer sustainably high payout yields, and strong earnings predictability. 

Australian stocks that score strongly across screens for payout yield (including capital returned via buybacks) and earnings predictability include: CSL, NVT, AMC, TLS, DLX, WOW, APA, CBA, BXB, SYD and CPU (the full rank of stocks is available on request).


The RBA needs to take 'credit' for debt aversion

The November credit aggregates confirmed that outside of mortgage lending, households and businesses remain reluctant to lift gearing and remain focussed on balance sheet repair.

Business credit expanded by 0.2% in November to be 4.5% higher than a year ago, while personal credit has been stagnant in the past year.  The recovery in personal and business credit since the crisis has been painfully slow.  Business credit has only just reached its pre-crisis peak, while personal credit remains around 10% below its pre-crisis peak (see chart).  That animal spirits in the corporate and household sectors remains dormant suggests that money has been tighter than implied by interest rates being at multi-decade lows.

The only part of the economy where animal spirits are buoyant is housing.  The stock of housing credit is 7% higher than a year ago, driven by owner-occupiers, but mainly investors.  Momentum in investor housing credit remains strong and it is noteworthy that it is 10% higher than a year ago.  Glenn Stevens, the RBA Governor, has previously flagged concerns about this segment growing at double digit rates, given that many of these loans are interest only.

Clearly, concerns that monetary policy ought to lean against the possibility of a bubble in housing continues to occupy the upper echelons of the RBA.  Deputy Governor Phillip Lowe, has previously published work with the Bank of International Settlements, suggesting that central bankers should be wary of large asset price gains when they associated with rapid growth in credit.  Thus the credit aggregates appear to be taking on greater importance in helping the RBA to disentangle fundamentals from speculative elements of asset price inflation.

As long as growth in business credit remains sluggish, bad and doubtful debts are likely to remain low by historical standards, while the anaemic growth in personal lending provides little cheer among discretionary retailers.

Behavioural traps for active managers to avoid (Part II)

In the second instalment of behavioural traps that active managers should avoid, Evidente argues that the costs of over-confidence out-weigh the benefits, recommends that portfolio managers should engage in DIY diversification rather than leaving it to corporates, and cautions PMs to not over-rely on DCF valuations.

In praise of being humble

A number of widely cited studies in the field of applied psychology document the above average driver effect, in which the overwhelming majority of respondents believe that their driving abilities are above average.  Over-confidence or illusory superiority is not confined to self-perceptions of driving ability.  Many people over-estimate their abilities, knowledge and future prospects compared to others.

Terrance Odean and Brad Barber have explored the effects of over-confidence in a financial market setting.  They assert that over-confident investors over-estimate the precision and accuracy of their information, which lifts the likelihood that such investors trade too frequently based on their perceived superior information.  The empirical evidence is not kind to over-confident investors; excessive trading is associated with inferior performance.

Odean and Barber also use over-confidence to link gender with trading performance.  Female portfolio managers have superior track records than their male counterparts thanks to lower churning of their portfolios because they are less prone to suffering from over-confidence.

The key lessons are obvious; PMs ought to be more humble and trade less.  Even when investors believe that they have access to superior information, they should be cognisant of the limits and costs to arbitrage, which can cause mispricing to persist for an extended time.

Ironically, the evolution in the structure of the funds management industry might actually reward over-confidence.  Fund of funds and asset consultants are increasingly shifting towards a core –satellite approach to portfolio construction, where index and smart beta products are combined with high conviction/high tracking error funds.  These funds typically require PMs to have a high degree of confidence in their stock calls, and be willing and able to take large active bets.

Overconfidence probably also contributes to the profitability of the betting against beta trade, which represents the poor returns from high beta stocks.  Overconfident PMs – particularly those working in high conviction funds whose clients expect high returns - are more likely to buy high beta or cyclical stocks to generate outperformance.  The strong appetite for such stocks lifts their price and drives down their expected future returns. 

The world’s most successful investor appears to have intuitively long understood the benefits of betting against beta.  In an academic article published recently (Buffett’s Alpha), researchers attribute Warren Buffet’s superior track record to his willingness and ability to use leverage to lift his exposure to low beta securities.

Don’t outsource diversification to corporates

In recent times, BHP announced a plan to spin-off its non-core assets into a new entity, South32, while Orica has sold its chemicals business to Blackstone after undertaking a strategic review of operations.  These announcements come not long after Amcor and Brambles undertook major restructuring, spinning off Orora and Recall respectively, while Tabcorp and Fosters have also completed demergers in recent years.

The trend towards greater corporate focus has had a long gestation period and is a welcome development.  Long gone are the days where it was common practice for firms to undertake mergers and acquisitions in unrelated industries to boost flagging growth prospects.  Growth prospects for many diversified enterprises have simply not met expectations with the failure stemming from a lack of management focus and the inability of internal capital markets to allocate resources efficiently across often disparate and unrelated business units.

Yet some investors continue to have a strong preference for conglomerates on the basis that diversified firms offer defensive attributes and are not forced to rely on at times fickle capital markets to raise funds.

The tendency to believe that that conglomerates represent ‘safe’ diversified firms stems from the availability and representative heuristics.  Some investors have a high familiarity with the strong track records of better known conglomerates with high profile CEOs, including GE and Wesfarmers, which have shaped investor perceptions about the benefits of corporate diversification (despite the fact that GE has performed dismally since the financial crisis).  From this small but highly influential sample, some PMs extrapolate and assign these attributes to other diversified firms.

The trend towards corporate focus and strong performance from focussed and less complex firms confirms that financial diversification has won over corporate diversification.  PMs who wish to participate in diversification benefits should do it themselves rather than out-sourcing to corporates.

Over-estimate the precision of DCF valuations at your peril

Price targets and DCF valuations have taken on a tremendous amount of importance amongst sell-side analysts over time.  Changes to recommendations are often supported by the price of a stocks being significantly higher or lower than the analyst’s target price, which is typically based on a DCF valuation.

Modelling a DCF valuation can offer a sell-side analyst a competitive advantage.  A detailed and granular model provides scope for sensitivity and scenario analyses, which some PMs have a strong appetite for.

But the long duration of stocks means that DCF valuations are awfully sensitive to inputs used, including the perpetuity growth rate and discount rate.  To illustrate, I use the Gordon Growth dividend discount model (DDM) which says that the price of a stock is equal to its prospective dividend discounted at the rate of the discount rate minus the perpetuity growth rate in dividends.

The standard approach is to use the Capital Asset Pricing Model to calculate the discount rate, which equals the sum of the risk free rate and the product of a stock’s beta and the expected equity risk premium.

The chart below depicts the non-linear relationship of the DDM valuation (vertical axis) to variations in the discount rate (horizontal axis).  The orange line corresponds to a high growth stock, and the blue line corresponds to a low growth stock.  Both stocks are assumed to pay a dividend of $5 in the next period. 

For the low growth stock, a small increase in the discount rate from 6% to 8% is associated with the DDM valuation halving from $250 per share to $125!  The relationship becomes flatter or less sensitive at higher discount rates.  But even a lift in the discount rate from 14% to 16% reduces the DDM valuation by close to 20%.

The steepness of the curve for the high growth stock confirms that the DDM valuation is even more sensitive to changes in the discount rate.  A rise of only 50 basis points in the discount rate to 9% is enough to reduce the valuation by half to $512.  To put the discount rate effect in perspective, subject to the assumptions used for the risk free rate and risk premium, a tiny rise in the stock’s beta from 0.8 to 0.9 is enough to generate a 50 basis point lift in the discount rate to 9%.

Insights from behavioural finance can help shed light on why sell-side analysts continue to rely heavily on DCFs in their decision making process, despite the sensitivity of inputs used.  First, the DCF valuation framework is considered by many to be more intellectually rigorous than other valuation techniques, including price to book and price to earnings ratios.  Second, the availability heuristic causes people to turn their attention to what is directly observable.  It so happens that the output of the DDM is easy to interpret and directly observable, while the inputs are not.  Third, the view that a stock has an intrinsic value helps to anchor our expectations and filter out what we consider to be irrelevant information.  Fourth, when billions of dollars are at stake, stakeholders assign a greater level of precision to DCF valuations than is warranted thanks to the institutional setting.

In short, PMs should be wary of sell-side analysts who bang the table with a high conviction buy or sell call based on their DCF valuation.  Over-estimate the precision of DCF valuations at your peril, particularly for high growth stocks.

Part III 

In the third instalment of this series, Evidente highlights the importance of seeking out independent and alternative sources of information to generate sustainable alpha, argues that price gaps do not necessarily amount to burst bubbles, and warns of the tendency and costs of riding losers for too long and selling winners too early.


Behavioural Traps for Active Managers to Avoid (Part I)

Behavioural finance is the intersection of applied psychology and the behaviour of financial market participants.  The likes of Richard Thaler, Nicholas Barberis, James Montier, Nobel prize winners, Robert Shiller and Daniel Kahneman, and many others have done a tremendous job in elucidating the heuristics or mental rules of thumb that investors (and broking analysts) rely on, which contribute to systematic errors in judgement and decision-making.

Some of these heuristics include: representativeness (leads to extrapolation), availability (leads people to over-estimate the probability of familiar and salient events), anchoring or framing (can distort decision making by affecting a person's frame of reference) and self attribution or over-confidence (people attribute their good performance to skill and judgement, and poor performance to bad luck or factors beyond their control).

Although these errors are not unique to financial market participants, it is reasonable to think that such errors can be costly, particularly when portfolio managers are managing billions of dollars.  If enough investors suffer from such biases they also lead to significant limits to arbitrage, which imposes costs and risks on investors who are less ‘irrational.’

2014 has proven to be another difficult year for active fund managers in Australia and worldwide for cyclical and structural reasons.  The unexpected decline in sovereign bond yields confirms that investors eschewed risk from their portfolios.  Further, the structural shift towards low cost beta like products that commenced since the financial crisis continued, as investors remain sceptical of the ability for active funds to consistently deliver alpha after costs and fees.

At a time when the philosophy of active management is coming under attack as active funds continue to lose market share to ‘dumb’ and ‘smart’ beta products, it behoves PMs to be cognisant of, and avoid behavioural traps.

Hindsight bias

Hindsight bias is better known colloquially to many people (at least in the United States) as the ‘Monday quarterback’ phenomenon.  In the best seller, Expert Political Judgement, Phillip Tetlock argues that hindsight bias amounts to discounting counterfactual scenarios that might have realistically emerged when considered in real time.  He provides compelling evidence that political scientists are prone to look back and believe incorrectly that they had predicted certain outcomes that came to pass.

It is far too easy for fund managers to also fall into this trap because they forget what their views might have been in real time.  After all, financial markets are noisy at the best of times, particularly as the signal to noise ratio is typically low.

There is good reason why financial market participants suffer from hindsight bias.  In an industry where the ability to articulate a convincing story is just as important as track record to growing assets, over-confidence can be a valuable commodity.  But hindsight bias and over-confidence are detrimental to delivering alpha because they limit the ability for broking analysts and investors to learn from past mistakes.

The obvious way for PMs to avoid this behavioural trap is to diligently document their views in real time, which provides scope to look back and benchmark those views with events that subsequently transpired. 

The process can also help to disentangle the role of luck from skill.  For instance, an overweight position in Qantas in early 2014 might have been justified on the prospect of a CEO succession event in the near term.  No such event transpired, but the overweight position has been profitable, based primarily on the precipitous fall in crude oil prices that few had predicted at the start of the year.

The stock market is not a discount store

Profit warnings are a godsend to brokers.  They provide much need volatility and generate trading opportunities largely because they garner the attention of PMs, some of whom like to engage in bargain hunting.  The problem is that the stock market is not a discount store.  The discount store mentality arises due to framing, which distorts the investor’s perspective because they have been conditioned or become accustomed to a higher stock price.  So a profit warning and a sharp fall in price triggers a view that a stock is cheap and thus offers a bargain.

In late 2013, QBE issued a profit warning, citing problems in their North and South American operations, lower than expected investment earnings stemming from the US Federal Reserve’s zero interest rate policy and the persistently high $A.  The stock subsequently fell by over 30%, representing an 8 standard deviation event.  Analysts downgraded their earnings forecasts by around 20%. 

On face value, this amounted to a market over-reaction.  But it is reasonable to think that investors were assigning a higher beta and discount rate to the company’s future growth prospects, thus accounting for the stock’s sharp price decline.  After all, this was another in a long line of profit warnings, the business is a complex and globally diversified insurance company with poor visibility in its far flung operations, and management continue to deal with the legacy of two decades of acquisition led growth.

A number of broking analysts at the time upgraded their recommendation to buy, thanks to the view that the profit warning represented a clearing of the decks of sorts, particularly as it was accompanied by the resignation of the company’s chairperson.  Some of those analysts – influenced by the sharp rise in global bond yields in May 2013 associated with the ‘taper tantrum’ – also believed that interest rates would continue to increase over the course of 2014 associated with a normalisation of US monetary policy, which would be a tailwind for the company's investment earnings.

As it happened, yields subsequently fell sharply in 2014, most of the world’s central banks maintained zero interest rate policy settings, and despite the stock bouncing in the month after the profit warning, twelve months down the track, QBE has performed broadly in line with the market (see chart).

Who’s afraid of stocks trading at a 52 week high?

Price momentum is one of the most widely studied and robust pricing anomalies documented in equities and other asset classes, across time and countries.  Stocks that perform well over six to twelve months tend to continue to yield strong returns for up to six months.

Journal research from the United States provides an interesting twist on the momentum anomaly; stocks trading at or close their 52 week high continue to yield strong returns in the short-term. 

The authors offered a behavioural explanation; many investors are put off by buying such stocks due to concerns that the horse has bolted; a corollary of the discount store framing.  An institutional explanation might also be at play.  Portfolio managers may believe that they have reputational risk to manage if they buy a stock at its peak and it subsequently under-performs, based on concerns at being seen to be swayed by investor sentiment.

My back-testing work for Australia over the past decade shows that stocks trading at or near their 52 week high have continued to outperform in the short term, and 2014 was no exception.  An equal weighted portfolio spread across the 15 large cap stocks trading at a 52 week high at the end of 2013 has yielded a total return of 6.7% year to date, well above the 4.5% from the ASX100 index.  A number of stocks underpinned the outperformance: RHC, SEK, TAH, TLS and AMC, while the key drags were NVT and TPI.

Given that investors eschewed risk in their portfolios over the course of 2014, it is little surprise that the current basket of stocks trading at or near their 52 week high has a strong defensive theme: CTX, GPT, RMD, TLS, TCL, SYD, ANN, COH, NVN, SKI, IPL, APA, ORA, CBA and RHC.

Do not be seduced by a company’s growth prospects and the art of storytelling

A cornerstone of behavioural economics and finance is that we rely on heuristics or rules of thumbs to help us deal with information overload, since humans can absorb and process only so much information.  Financial markets are an apt setting to investigate these heuristics because portfolio managers are confronted with tremendous amounts of information, much of which is noise.

Story telling iss an effective way to help people to make sense of their world, as well as process and communicate information.  People can relate to stories, they can benchmark the stories of others with stories of their own, and stories garner people's attention.  Many CEOs understand this and are able to articulate a compelling story to buy their stock based on the prospect of strong growth.

Buying a basket of stocks with high expected growth in profitability at the end of 2013 has yielded an equal weighted return of over 10% year to date, well above the index return.  But this represents the exception; these stocks have typically delivered dismal returns over the sweep of the past decade (chart is available on request).  The third quartile or mid-growth stocks represents the sweet spot.

The poor returns from high growth stocks is not unique to Australia; the high growth anomaly is robust across the United States and other countries.  The poor performance reflects a number of factors.  Seduced by the prospect of strong growth and possibly some compelling storytelling, investors are lulled into over-paying for future growth.  Second, broking analysts and PMs tend to extrapolate past growth too far into the future.  Third, investors under-estimate the level of risk and uncertainty associated with high forecast growth.

Conversely, the mid-growth stocks are perceived by many to be dull, offering the prospect of little capital growth, and pay out high dividends due to limited growth opportunities.  Because they do not provide as a compelling story as the blue sky embedded in high growth stocks, PMs are prone to under-pay for these attributes.

At present, stocks with high forecast growth (stocks to avoid) are: ILU, OSH, ALL, CSR and BSL, while mid-growth stocks (stocks to buy) include: ANN, TLS, PRY, SGM and TAH.

The illusion of control and the (limited) influence of CEOs

Individuals - particularly those that are over-confident - typically over-estimate the control they have over events, and discount the role of chance or factors beyond their control.  Since many financial market participants are over-confident, PMs need to be careful that they do not over-estimate the importance of management quality on company performance.

Many PMs like to showcase their ability to identify and only invest in companies with good quality management.  CEOs are the custodians of shareholders’ funds, so skilled managers whose interests are aligned with shareholders ought to be necessary conditions for a company to deliver sustainably strong returns.

But factors beyond the control of the CEO and management affect the profitability and performance of a stock, including the state of the domestic and global economy, outlook for interest rates, the supply and demand for credit, shifts in technology and consumer tastes, unexpected changes in the regulatory environment, health of the banking system, and investor sentiment, just to mention a few.

Sydney Airport (SYD) demonstrates that good quality management can have little bearing on a stock’s performance.  SYD is a monopoly asset that generates highly predictable cash flows, with limited exposure to the economy primarily through passenger numbers. 

Shifts in the $A are broadly neutral for passenger numbers; a fall in the currency this year encouraged a lift in overseas arrivals but reduces the number of Australians travelling abroad.  Passenger numbers in the past have been adversely affected by factors beyond the control of management, including the spread of the SARS virus and the s11 attacks.

More recently, the strong outperformance of the stock reflects factors that have little to do with management: the strong appetite for safe assets, subdued top line growth for most companies thanks to the economy remaining stuck in a nominal recession, the decline in sovereign bond yields and continued strong performance of the yield trade.

PMs should not entirely discount the role of management and the incentives they face as a guide to the alignment (or non-alignment) of interests with those of shareholders.  But they should not discount the role that systematic factors outside of a CEO's control play, in driving stock performance.

Part II

In the second instalment, Evidente will discuss other behavioural traps for active managers to avoid, including: over-estimating the precision of DCF valuations, dangers associated with neglecting the regulatory and fiscal landscapes, the problems of chasing down answers to questions that don't matter, and the importance of seeking out alternative and objective sources of information.