

US employment growth moderates, buying the Fed and growth investors more time
/The March non-farm payrolls release confirmed that employment in the United States continues to expand but at a more moderate pace over the past three months. The US economy added a net 600k jobs in the March quarter down from 970k jobs in the December quarter (see chart). The unemployment rate remained steady at 5.5%, well below it peak of 10% and its lowest level in six years.

The decline in the labour force participation rate - the percentage of the civilian population either in employment or actively looking for work - from a peak of over 66% in 2007 to its current level of 63% - has assisted the fall in the unemployment rate. An understanding of the mechanics of the unemployment rate helps to shed light on how lower workforce participation has contributed to a lower unemployment rate (see graphic).

Assuming a participation rate of 66% - the average of the credit boom - translates into a counterfactual unemployment rate of over 10%. Of course, this scenario assumes that total employment remains unchanged from its current level of 148.3 million, which is unrealistic because greater labour force participation would be associated with stronger labour market conditions and higher employment. This does not invalidate the counterfactual exercise, but does highlight just how sensitive the unemployment rate is to changes in the participation rate.
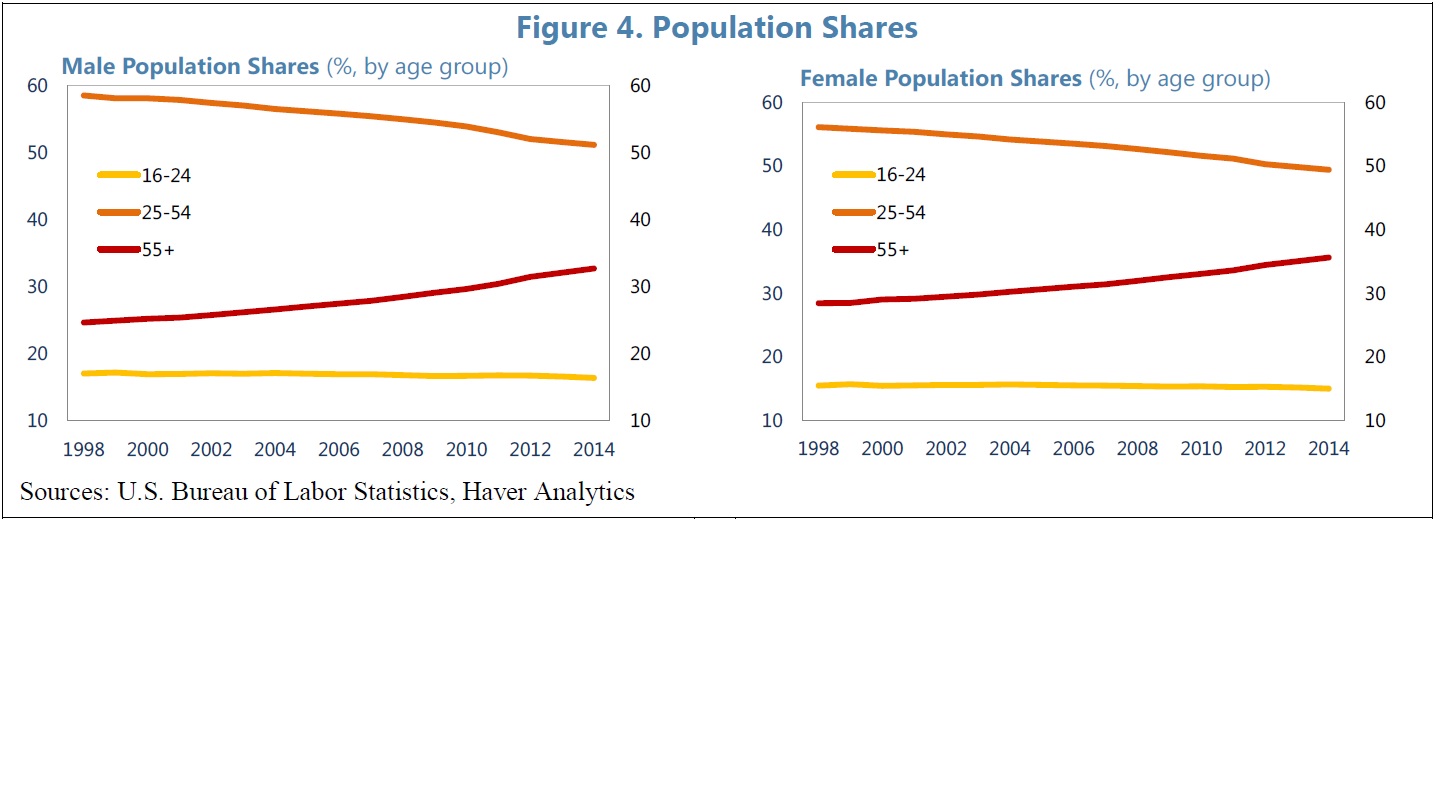
How much of the post-2007 decline in the participation rate is structural is important to gauge the amount of slack in the US labour market and the future course of monetary policy. The ageing of the baby boom generation has helped to underpin lower workforce participation, because older people have lower participation rates than prime age workers (see chart). A recently published IMF study suggests that at least half of the three percentage rise in the participation rate post-2007 is irreversible, thanks mainly to the demographics of ageing.
A participation rate of 64.5% for instance, produces an unemployment rate of 8%, providing further evidence that there is plenty more labour market slack than implied by the current unemployment rate of 5.5% and sheds light on why US inflation pressures remain dormant despite the decline in the unemployment rate. The Phillips curve, which formalises the short-run inverse relationship between inflation and unemployment, has flattened considerably since the financial crisis, and confirms that core inflation has become less responsive to changes in the unemployment rate (see chart).

The flatter slope reflects 1) the fact that the unemployment rate has become a less reliable barometer for labour market conditions due to structurally lower labour force participation; and 2) inflation expectations remain well anchored. The flatter Phillips curve suggests that further cyclical improvement in the labour market might not lead to inflation moving back towards the Federal Reserve's 2% objective, giving the central bank scope to remain patient in it approach to normalising monetary policy.
In fact, since mid-2011, the core CPI has decelerated to an annualised rate of 1.5%, well below the Fed's target and down from 2.8% at a time when the unemployment rate has declined by over three percentage points (see chart). So much for the prevailing conventional wisdom that the large pool of long-term unemployed would give rise to inflationary pressures at high rates of unemployment due to hysteresis effects (ie. de-skilling).

Discount rate shocks: A key risk for growth investors
Deliberations of the Federal Open Market Committee about the much anticipated timing of lift-off of the Federal Funds rate might seem far removed from the day to day decisions and portfolio returns of growth investors. But an analysis of the performance of stocks around the taper 'tantrum' in May 2013 reveals the sensitivity of premium rated growth stocks to the future course of monetary policy. In his testimony to Congress on 22 May 2013, Ben Bernanke flagged that he expected the Fed to start to slow or taper the pace of bond buying later in the year, conditional on continuing good economic news. Yields on 10-year Australian Commonwealth Government Securities jumped by around 20 basis points and the ASX200 fell by 5% during that week.
The chart below reveals that premium rated growth stocks were among the worst performing stocks in the ASX200. In fact, the four stocks that yielded the lowest returns were all high PE, high growth stocks: CTD, DMP, IIN and REA. Many of these and the other premium rated growth stocks in the list are low beta or defensive, so the strong under-performance probably reflects the long duration attributes of high growth stocks. The taper tantrum highlights that the implied discount rates that investors apply to the expected future cash flow of these stocks are clearly vulnerable to any sudden and unexpected increases in the risk free rate.
Since the taper tantrum, Australian 10 year government bond yields have declined by around 100 basis points to 2.3%. The associated fall in expectations of the risk free rate has probably been a tailwind in the out-performance of premium rated growth stocks; the list of stocks in the chart above have produced a median return of 44% since then, well above the ASX200 (30%).
Good news for growth investors (for now)
The lesson for growth investors is that discount rate shocks represent a key risk for their portfolio performance because of the long duration attributes of growth stocks. But the good news is this; the recent moderation of US employment growth, still considerable slack in the US labour market, and little prospect that core inflation will move back to the Fed Reserve's 2% objective anytime soon, should buy more time for not just the Fed but also growth investors.
