Beware of bubble talk, for now (Part II)

In last week’s blog post, I discussed a wide ranging speech delivered by the RBA Governor in New York on April 21st (The world economy and Australia), in which he acknowledged that corporate Australia’s capital restraint of recent years reflected in part the fact that the cost of capital or hurdle rates used in capital budgeting decisions had remained sticky.  Despite the reduction in rates of return available on safe assets in Australia and globally, there has been an offsetting rise in the expected equity risk premium.  Sovereign bond yields globally have declined to record lows precisely because investors expect to be compensated more for taking on stock risk.

At times in the past year, having bemoaned the absence of entrepreneurial risk taking in Australia and implored businesses to invest for future growth, Mr Glenn Stevens’ comments provide the clearest indication yet that the RBA understands that animal spirits will be dormant for as long as the risk premium remains high.  The central bank's conduct of monetary policy over the course of this extended easing cycle suggests that it continues to under-estimate the power of monetary policy to influence the psychology of risk taking.  I concluded in last week's post that the risk premium would remain high and that multiples on low beta or defensive securities would remain elevated for as long as the capital discipline remains pervasive across corporate Australia.

A recurring question from portfolio managers that I spoke to last week related to the 'when' and 'what'; when will entrepreneurial risk appetite return and what range of indicators represent an accurate barometer of the risk premium?  I believe that the labour market provides fertile ground because new cost discipline has extended to a reluctance by businesses to hire in recent years.  Further, the labour force survey is a higher frequency and more up to date indicator than the capex survey compiled by the Australian Bureau of Statistics. 

The market understands the significance of labour market conditions at least for monetary policy deliberations; the implied probability of a rate cut at the RBA's May board meeting declined to 55% from over 75% immediately following the release of stronger than expected March employment data in mid-April (see chart).

But investors might have been premature in discounting the chances of another rate cut because a range of indicators point to still considerable slack in the labour market.  The persistent weakness in labour market conditions provides compelling evidence that the corporate sector's animal spirits remain dormant.

Record low wages growth

Growth in private sector wages has been moderated for over three years now, and the current annual rate of 2½% represents the slowest pace of growth on record, confirming that demand for labour remains subdued (see chart).

Strong discouraged worker effect, particularly among young people

The participation rate has stabilised at between 64½% and 65% in the past two years, but this remains at its lowest level since 2006 (see chart).  The low participation rate points to weak cyclical conditions which  discourage people from seeking jobs, and also reflects the demographics of ageing because older people typically have low rates of labour force participation.  The decade low level in the ratio of employment to working age population confirms that cyclical weakness in labour market conditions.

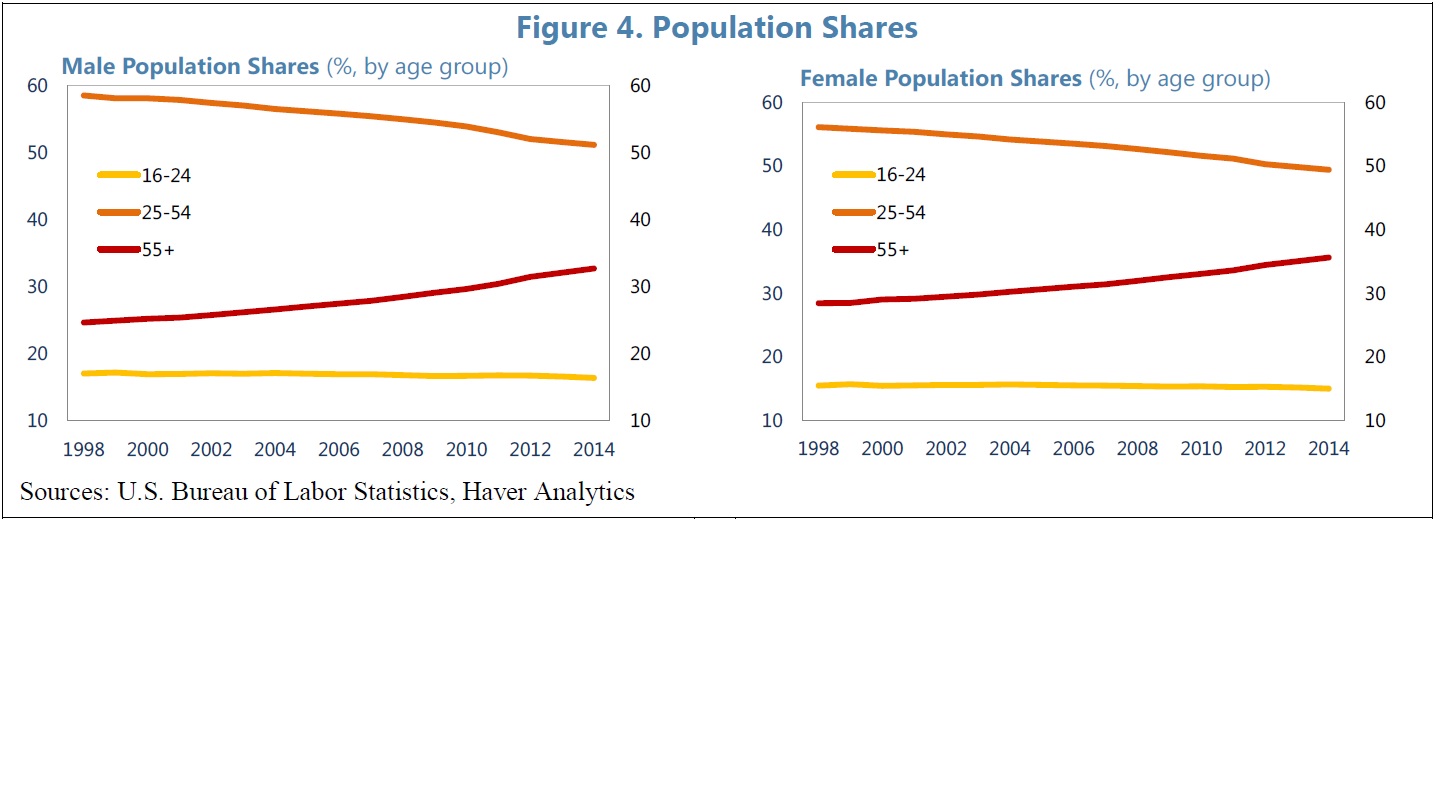
The discouraged worker effect seems to have been especially strong among young people (those between the ages of 15 and 24).  The participation rate among young people declined to a record low of 66% in 2014, down from 71% in 2008 (see chart).  Professor Jeff Borland, a labour market economist at the University of Melbourne, draws attention to the fact that the labour market for young people is particularly sensitive to cyclical conditions.  The number of young people looking for work tends to drop sharply during a downturn because hiring rates typically decline and young people account for a disproportionately high share of new hires.  Early signs of a revival in job prospects among young people have emerged in the past six months, although the participation rate of 67% remains low by historical standards.

Downward trend in average hours worked

Total hours worked has continued to grow, assisted by strong population growth, but average hours worked has been roughly stagnant now for two years and remains well below its level in 2006 (see chart).

Hiring intentions remain subdued

Forward looking measures of labour market conditions remain weak.  Both the level of job ads and job vacancies are below 1.3% of the labour force, suggesting that businesses remain cautious in their hiring intentions (see chart). 

Australia's unemployment rate is high by international standards

Australia's unemployment rate has remained above 6% for ten consecutive months, the longest stretch since 2003 (see chart).  In fact, the unemployment rate in Australia of 6.1% remains well above that of the United Kingdom, Japan, United States and New Zealand (see chart).

Unemployment duration continues to grow

People unemployed for more than 52 weeks has climbed to almost one-quarter of the total pool of unemployed, which represents the highest level since inception of the long-term unemployment ratio in 2001 (see chart).

BubbleTalk-LongTermUnemployed.jpg

The financial crisis and greater job insecurity

The Westpac/Melbourne Institute survey of unemployment expectations has increased by around 50% in the past four years to a level well above historical norms, confirming that one of the key legacies of the financial crisis is a heighted level of job anxiety (see chart).  Greater job insecurity might help to explain why households are saving the biggest slice of their incomes since the late 1980s and why the much anticipated re-bound in discretionary retail spending is yet to materialise.

THE RENEWED COST DISCPILINE: GOOD NEWS FOR SHAREHOLDERS, BAD NEWS FOR WORKERS

The persistent weakness in labour market conditions and renewed cost discipline are consistent with anecdotal evidence that the ASX200 companies continue to trim costs aggressively.  Hills Industries has announced that it 'continues to accelerate efforts to reduce group overheads and drive further structural efficiencies in its core business' , Woolworths has committed to a pipeline of cost savings in excess of $500m in its Australian Supermarkets division, and Myer has announced a strategic review under the leadership of its new CEO and is no longer proceeding with a store opening originally planned for Greenhills in NSW.

Anaemic revenue conditions continue to shape the corporate environment and the relentless focus on cost discipline.  The chart below illustrates the powerful revenue headwinds that corporate Australia has faced; forecast revenues from the ASX200 companies is at the same level that prevailed four years ago, at the peak of Australia's terms of trade boom.  Listed companies will therefore continue to seek ways to restructure, trim costs, and lift productivity to  boost profitability and cater to investors' insatiable appetite for income.  The fact that CEOs are focussing on the 'internals' or what they can control is a welcome development and a long way from chasing the pipedream of double digit revenue growth common to the credit boom years.

The renewed cost discipline is good news for shareholders but bad news for workers and job seekers.  Those waiting for an improvement in labour market conditions to signal a reduction in the risk premium associated with a revival in animal spirits will need to be patient, particularly as the RBA appears to be more concerned about the growing risks from speculative activity in housing than the costs of rising unemployment and under-employment. 


Beware of bubble talk, for now

In a wide ranging speech delivered overnight in New York, Glenn Stevens, provided more colour on his prior communications in which he has bemoaned the low level of entrepreneurial risk taking across Australia's corporate sector and implored businesses to invest for future growth prospects.

I have long argued that animal spirits remain dormant in Australia (and across most of the developed world) thanks to persistent revenue headwinds and high discount rates that companies are assigning to expected future cash flows for potential new projects.  Moreover, companies continue to cater to investors' insatiable appetite for income by lifting payout ratios.

At first glance, the persistence of a high cost of capital is difficult to reconcile with the risk free rate or yields on sovereign bonds being at record lows.  But Mr Stevens has acknowledged that lower returns on safe assets have not pulled down the cost of capital because there has been an offsetting rise in the equity risk premium.  The RBA Governor argues that the stability of earnings yields in the face of declining long term interest rates implies that the risk premium has lifted, reflecting more risk being assigned to future earnings and/or lower expected growth in future earnings (see chart).  Mr Stevens also highlights anecdotal evidence of stickiness in hurdle rates used by corporate Australia.

I have previously argued that long term interest rates are low precisely because the equity risk premium has shifted up (see the blog post from 26 November 2014 - Low interest rates are here to stay but don't expect stocks to re-rate).  That is, investors have gravitated towards safe assets as they have perceived a still high level of risk in the world.  From a capital budgeting perspective, the risk free rate is low due to factors that are restraining corporate investment: low expected earnings growth and a high expected risk premium.  Consequently, stock multiples should not get an assist from a lower risk free rate given a higher ERP and lower growth prospects.

A behavioural perspective on the risk premium and cost of capital

The common misconception that record low interest rates should be associated with a re-rating of stocks stems from the availability heuristic that is a cornerstone of behavioural finance.  Events that are memorable, directly observable and have a high valency are more likely to resonate with us.  The risk free rate is directly observable on a daily basis, so our familiarity with low long term interest rates informs our mental framing of the cost of capital.  But the equity risk premium is not directly observable, and so we are likely to neglect it as a source of variation in the cost of capital.  Just because the ERP cannot be directly observed, does not mean that it should be ignored.  

In fact, from the perspective of monetary policy, the ERP is a key channel in which a central bank can influence the psychology of risk taking.  If a central bank is seeking to revive animal spirits in the corporate sector, it must do so by reducing the expected equity risk premium (as well as lifting expectations of revenue growth).

If the lift in the risk premium has broadly offset lower returns on safe assets, then the effect on the multiple of the market ought to be neutral.  But this masks important sources of cross variation between high and low beta stocks.  High beta stocks are associated with greater sensitivity of their cost of capital to shifts in the risk premium.  For instance, a lift in the risk premium from 4% to 5% causes a high beta stock's cost of equity to rise by 150 basis points, while the cost of capital for a low beta stock rises by less than 50 basis points (see chart). 

While not shown here, mathematically, the percentage increase in the multiple of a high beta stock exceeds that of a low beta stock in an environment where the risk premium is rising, other things being equal.  Moreover, it is reasonable to think that low beta stocks have experienced a larger compression of their betas in recent years than their high beta counterparts, as investors have assigned lower risk to the future earnings of defensive stocks. 

Indeed, the pattern confirms that the defensive sectors in the Australian market are trading at a premium (based on dividend multiples) to their 10 year median estimates, while cyclical sectors are trading at or below their historical medians (see chart).  While lower expected earnings growth has contributed to this trend, we believe that the higher equity risk premium has played an important role in driving a wedge in the multiples between high and low beta stocks.

Beware of bubble talk, for now

It might be tempting to think that either defensive stocks or high yielding stocks with strong and sustainable sources of competitive advantage are exhibiting bubble like valuations.  But shifts in the risk premium and cost of capital matter for portfolio construction, and our analysis suggests that they have contributed to the relative rise in valuations for low beta or defensive stocks.  I expect those high valuations to persist while the corporate sector's animal spirits remain dormant.  The unwinding of the defensive trade will eventually happen abruptly, but that remains way off as long as output remains below potential, there is deficient aggregate demand, unemployment is well above the natural rate, and inflation remains subdued.


Who's Afraid of Deflation?

Concerns about deflation - the phenomenon of falling prices of goods and services - in the wake of the financial crisis, have provided the intellectual cornerstone for central banks around the world - led by the Federal Reserve - to embrace unconventional policy measures, notably forward guidance and large scale asset purchases or quantitative easing.

The deflation aversion has greatly influenced policymakers in the United States, thanks to the legacy of the Great Depression and the fact that the former Governor of the Federal Reserve, Ben Bernanke, remains a leading authority on this episode.  Most economic historians attribute the depth and long duration of the Great Depression to excessively tight monetary policy pursued by the newly formed Federal Reserve at the time.  More recently, central bankers have also been keen to avoid the decade long deflation that has afflicted Japan.

The Bank of International Settlements has recently examined the historical record of deflation and output growth (The costs of deflation: A historical perspective).  The analysis is based on a newly developed dataset of 38 economies covering 140 years.  Their key findings are as follows.

1. There is only a very weak link between deflation of goods and services and growth in output.  On face value, the finding suggests that deflation is not particularly costly.

2. There is a stronger link between asset price deflations - particularly falling property prices - and output growth.

3. The modern day pre-occupation with deflation stems from the Great Depression, where deflation was associated with significant output losses.

4. Japan's deflation in recent decades might reflect the rapid ageing of the country's population.  When controlling for the demographics of ageing, Japan's economic performance has been comparable to the United States since the turn of the century. 

5. The BIS study concludes that policy makers should not necessarily be afraid of deflation in goods and services, but should be vigilant in monitoring and responding to asset price deflation, particularly persistent declines in property prices.

Based on a simple demand-supply framework, it is self-evident that not all deflationary episodes are pernicious.  Falling prices of goods and services can reflect a demand shock, a supply shock or a combination of the two.  The diagram below show that bad deflation is associated with lower demand (ie. lower prices and output), while good deflation is associated with a positive supply shock (ie. lower prices and higher output).  Bad deflation is contractionary while good deflation is expansionary.  This framework downplays the causal role of deflation; rather, it interprets deflationary episodes as symptomatic of unexpected shifts in demand and supply.

A positive supply side shock might reflects factors which lift a country's productivity growth or supply of inputs, such as innovation, technological change and permanent tax cuts which induce greater workforce participation.  The results of the BIS study - that goods and services deflation does not appear to be costly on average over the sweep of the past 140 years - suggests that positive supply side shocks have played an important role in underpinning deflationary episodes in the past. 

With the exception of Japan, few countries have experienced persistent deflation in recent decades.  But many countries have undergone a period of disinflation in goods and services - a moderation in the rate of price growth - since the financial crisis.  During this time, prices of goods and services in advanced economies have expanded at a compound annual rate of well below 2% compared to growth of 2-3% during the credit boom (see chart). 

The Great Disinflation - A Demand Contraction

The fact that growth in real GDP has also slowed markedly since the financial crisis confirms that a contraction in demand has underpinned the Great Disinflation.  Moreover, house prices remain below their prior peak in the United States and many advanced economies which offers compelling evidence of an adverse and persistent demand shock (see chart).  The finding of the BIS study that property price deflations have historically been associated with significantly weaker output growth probably reflects the fact that lower house prices undermine aggregate demand by reducing wealth and collateral values.  Thus falling house prices combined with deflation or disinflation of goods and services represents a clear signal of an adverse demand shock that central banks should remain vigilant towards.

Contrary to the conclusions of the BIS study, I am sceptical that Japan's rapidly ageing population has caused or contributed to its persistent deflation in recent decades.  It is widely accepted that ageing is associated with a negative demand shock which other things being equal, should be deflationary.  But a smaller working age population is also associated with a contraction in supply, which should be inflationary.  In my view, Japan's deflation stems from a shortfall in aggregate demand related to the tight stance of monetary policy (up until recently) and an unwillingness of successive governments to let zombie banks die.  The more aggressive stimulus adopted by the Bank of Japan under its new Governor is therefore a welcome development.

Revival of animal spirits crucial to the outlook

Central banks have been justified in resorting to unconventional policy measures to address growing deflationary risks associated with the shortfall in aggregate demand since the financial crisis.  The series of synchronised policy easings by many of the world's central banks through January and February should be viewed through this prism.  For too long since the financial crisis, some central bankers and many commentators have under-estimated the power of monetary policy.  Even if the equilibrium global interest rate has declined - as argued by Ben Bernanke in his recent blog post - monetary policy still has an important role to play in boosting the psychology of risk taking in the corporate and household sectors.  

US employment growth moderates, buying the Fed and growth investors more time

The March non-farm payrolls release confirmed that employment in the United States continues to expand but at a more moderate pace over the past three months.  The US economy added a net 600k jobs in the March quarter down from 970k jobs in the December quarter (see chart). The unemployment rate remained steady at 5.5%, well below it peak of 10% and its lowest level in six years. 

The decline in the labour force participation rate - the percentage of the civilian population either in employment or actively looking for work - from a peak of over 66% in 2007 to its current level of  63% - has assisted the fall in the unemployment rate.   An understanding of the mechanics of the unemployment rate helps to shed light on how lower workforce participation has contributed to a lower unemployment rate (see graphic). 

Assuming a participation rate  of 66% - the average of the credit boom - translates into a counterfactual unemployment rate of over 10%.  Of course, this scenario assumes that total employment remains unchanged from its current level of 148.3 million, which is unrealistic because greater labour force participation would be associated with stronger labour market conditions and higher employment.  This does not invalidate the counterfactual exercise, but does highlight just how sensitive the unemployment rate is to changes in the participation rate.

How much of the post-2007 decline in the participation rate is structural is important to gauge the amount of slack in the US labour market and the future course of monetary policy.  The ageing of the baby boom generation has helped to underpin lower workforce participation, because older people have lower participation rates than prime age workers (see chart).  A recently published IMF study suggests that at least half of the three percentage rise in the participation rate post-2007 is irreversible, thanks mainly to the demographics of ageing.  

A participation rate of 64.5% for instance, produces an unemployment rate of 8%, providing further evidence that there is plenty more labour market slack than implied by the current unemployment rate of 5.5% and sheds light on why US inflation pressures remain dormant despite the decline in the unemployment rate.  The Phillips curve, which formalises the short-run inverse relationship between inflation and unemployment, has flattened considerably since the financial crisis, and confirms that core inflation has become less responsive to changes in the unemployment rate (see chart).

The flatter slope reflects 1) the fact that the unemployment rate has become a less reliable barometer for labour market conditions due to structurally lower labour force participation; and 2) inflation expectations remain well anchored.  The flatter Phillips curve suggests that further cyclical improvement in the labour market might not lead to inflation moving back towards the Federal Reserve's 2% objective, giving the central bank scope to remain patient in it approach to normalising monetary policy. 

In fact, since mid-2011, the core CPI has decelerated to an annualised rate of 1.5%, well below the Fed's target and down from 2.8% at a time when the unemployment rate has declined by over three percentage points (see chart).  So much for the prevailing conventional wisdom that the large pool of long-term unemployed would give rise to inflationary pressures at high rates of unemployment due to hysteresis effects (ie. de-skilling).

Discount rate shocks: A key risk for growth investors

Deliberations of the Federal Open Market Committee about the much anticipated timing of lift-off of the Federal Funds rate might seem far removed from the day to day decisions and portfolio returns of growth investors.  But an analysis of the performance of stocks around the taper 'tantrum' in May 2013 reveals the sensitivity of premium rated growth stocks to the future course of monetary policy.  In his testimony to Congress on 22 May 2013, Ben Bernanke flagged that he expected the Fed to start to slow or taper the pace of bond buying later in the year, conditional on continuing good economic news.  Yields on 10-year Australian Commonwealth Government Securities jumped by around 20 basis points and the ASX200 fell by 5% during that week.

The chart below reveals that premium rated growth stocks were among the worst performing stocks in the ASX200.  In fact, the four stocks that yielded the lowest returns were all high PE, high growth stocks: CTD, DMP, IIN and REA.  Many of these and the other premium rated growth stocks in the list are low beta or defensive, so the strong under-performance probably reflects the long duration attributes of high growth stocks.  The taper tantrum highlights that the implied discount rates that investors apply to the expected future cash flow of these stocks are clearly vulnerable to any sudden and unexpected increases in the risk free rate. 

Since the taper tantrum, Australian 10 year government bond yields have declined by around 100 basis points to 2.3%.  The associated fall in expectations of the risk free rate has probably been a tailwind in the out-performance of premium rated growth stocks; the list of stocks in the chart above have produced a median return of 44% since then, well above the ASX200 (30%). 

Good news for growth investors (for now)

The lesson for growth investors is that discount rate shocks represent a key risk for their portfolio performance because of the long duration attributes of growth stocks.  But the good news is this; the recent moderation of US employment growth, still considerable slack in the US labour market, and little prospect that core inflation will move back to the Fed Reserve's 2% objective anytime soon, should buy more time for not just the Fed but also growth investors.


Taxing Times

The Government release of Re:think, its tax discussion paper, is a welcome development, designed to kick-start the conversation with the community on a range of reform options designed to achieve a simpler and streamlined tax system capable of meeting the growing needs of an ageing population. 

In this post, I discuss some of the areas raised in Re:think which are of greatest interest to equity investors: how important income and consumption taxes are to Australia's tax take in a global context, the prospect of the growing drag from bracket creep on household disposable incomes (discretionary retailers), the outlook for the GST (supermarket retailers), the efficacy and viability of the dividend imputation system (high yielders with predominantly domestically oriented operations), the sustainability of the concessional tax treatment of superannuation (asset managers), and the risk associated with companies that have low effective tax rates.

The great divergence

Although Re-think does not consider the outlook for government spending, the conversation about the viability of Australia's tax system cannot be disentangled from trends in expenditures.  After growing in line with government outlays during the credit boom, tax revenue dropped sharply during the financial crisis and although it has recovered since then, it hasn't kept up with the path of government spending (see chart). 

Australia's ageing population will make it increasingly difficult for governments to reduce the growth in their spending.  The burden will thus fall on governments to reform the tax system to reduce its sensitivity to the economic cycle so that downturns are not associated with a large and persistent divergence between spending and tax revenue.  The federal Government collects around 80% of Australia's total tax revenue, mainly from taxes levied on individuals and companies, while state and territory governments collect 15% of tax revenue, largely through payroll taxes and stamp duties (see chart).

Australia's aggregate tax burden - 27% of GDP - is low by the standards of other developed economies, which reflects the overall size of government and the fact that Australia is one of the few countries that does not levy specific social security taxes.  Much of the media reaction to Re:think has been around Australia's excessive reliance on corporate and personal income tax, and what this might mean for the politically sensitive Australia's Goods & Services Tax.  Income tax levied on individuals accounts for 40% of total tax revenue and corporate taxes account for another 20%.  The combined contribution from these two sources is second only to Denmark (see chart). 

But the heavy reliance on corporate and personal income tax reflects Australia's low consumption tax take and the  fact that Australia does not levy a social security tax.  Social security contributions across the OECD represent a significant source of revenue, accounting for one quarter of tax revenue in developed countries.   Australia's consumption taxes generate around 27% of total tax revenue, below the OECD average of 32% (see chart).

The GST - Politically Hot Potato

The GST is Australia's main consumption tax which applies a rate of 10% to a range of goods and services. The rate is around half of the OECD average and the base is narrow, applying to only 47 of the consumption basket (see chart). 

The GST base has narrowed over time because Australians are increasingly spending a bigger slice of their budgets on health and education that are exempt from the GST (see chart).  Going forward, Australia's ageing population will likely further reduce the GST base.  Fresh food is also GST exempt.  Any efforts to broaden the base to capture fresh food would clearly have negative implications for food retailers Woolworths and Wesfarmers, although the effect on profitability would be partly ameliorated by government efforts to compensate low income earners.

But Re:think acknowledges that GST reform is a politically hot potato.  The Commonwealth Government collects the GST on behalf of the states and territories and all the revenue raised by the GST is provided to the states and territories.  Thus any change to the rate or base would require unanimous support of the state and territory governments.  Comments from the Prime Minister and Treasurer today confirm that any efforts to reform the GST would also be conditional on broad political consensus for change.  If the Shadow Treasurer's - Chris Bowen's - comments on the 730 Report tonight are any guide, support from the ALP is not forthcoming at this time (nor any time soon).

Bracket creep - A drag on discretionary retailers

Australia's tax system is progressive because higher marginal tax rates are levied at higher income levels.  Because the tax or income thresholds are not indexed, they remain fixed and do not keep up with inflation or wages.  So over time, income earners will find that they face higher marginal tax rates as their salaries grow beyond the tax thresholds.  This effectively leads to bracket creep which erodes the value of tax cuts.  At present, the second highest marginal rate of 37% is levied at gross incomes of $80,000 pa, while the top marginal rate of 45% applies to gross incomes above $180,000. 

Currently, average full time weekly earnings is around $75,000 which is associated with a marginal rate of 32.5% for each dollar earned above $37,000.  Based on the government's estimates, a full time employee is projected to move into the second highest tax bracket of 37% by 2016-17 (see chart).  In the absence of cuts to marginal rates or adjustments to income tax thresholds, bracket creep promises to be a drag on discretionary spending at a time when profitability for the discretionary retailers is little changed from a decade ago.

Rethink-BracketCreep.jpg

Target - Savings in superannuation?

Among saving vehicles, bank deposits attract the highest marginal tax rate followed next by foreign shares and property, while superannuation attracts the lowest tax rate because contributions are taxed at a flat concessional rate of 15% out of pre-tax income (see chart).  The flat concessional rate, when combined with the progressive income tax system, produces regressive outcomes.  That is, high income earners effectively receive the largest tax benefit from the superannuation system.  The discussion paper acknowledges the problems of distribution and fairness that the superannuation system gives rise to.

Thanks to the growing concerns of rising income inequality across many developed countries - including Australia - there is a growing risk that the tax breaks that Australia's superannuation system offers the wealthy will increasingly come under intense scrutiny, particularly from a government with little philosophical attachment to a system of forced saving.  While such changes would carry negative implications for Australian based asset managers, ironically they would be expected to be met with stiff opposition from the ALP, which was the party that launched superannuation in the early 1990s. 

But any measures designed to reduce the size and scope of superannuation tax concessions accruing to high earners and the wealthy would likely garner support from the cross benchers in the Senate.  Stocks that would be most adversely impacted are the pure play asset managers (BTT, MFG, PPT, PMC) and the major banks, all of which have significant wealth management operations.

Dividend imputation - Not in the firing line thanks to an ageing population

Any proposed changes to Australia's dividend imputation system is likely to arouse interest amongst institutional investors, particularly at a time when high yielding stocks with defensive cash flows have delivered strong performance for over three consecutive years.  The discussion paper draws attention to the costs to tax revenue associated with a full imputation system, which Australia has had in place since 1987.

But Re:think also addresses some of the key advantages of imputation.  First, it ensures that there is no double taxation of income earned by Australian shares owned by Australian resident shareholders.  Second, it supports the integrity of the business tax system because imputation does not encourage Australian companies to avoid tax; tax avoidance by Australian companies reduces their ability to pay unfranked dividends.  Third, imputation imposes an important source of discipline on CEOs since it encourages companies to pay out dividends rather than retain profits and discourages forays offshore, which have tended to be value destructive on balance over the sweep of the past three decades. 

Given the demographics of ageing, I doubt that this or any future government will tamper with the tax treatment of corporate payout that effectively encourages companies to cater to the growing influence of those approaching retirement age, and their preference for dividends over capital growth.

Regulatory risk surrounding corporate income tax set to grow

Corporate income tax is levied at a rate of 30% on all taxable income earned by companies, which is higher than the OECD average of 25% (see chart).  Re:think discusses the mobility of capital and the fact that Australia's relatively high corporate tax rate potentially deters foreign investment in Australia.

Despite the high corporate tax rate, Australian resident shareholders effectively pay a lower tax rate on their dividends than other country shareholders thanks to imputation.  Moreover, it is not entirely clear just how much of a deterrant to foreign investment is associated with Australia's high corporate tax rate.  After all, the corporate tax rate levied in the United States is amongst the highest in the OECD at close to 40%.

Indeed, there is a case for lifting the corporate tax rate.  First, after peaking at a record high of 25% during the credit boom, the corporate tax take as a share of economy wide profits has fallen to 17.5%, below its long run median (see chart).  Second, the mining boom saw a reduction in effective tax rates due to the growing depreciation and amortisation expenses associated with the construction of mining and LNG projects.  The size of this effect is already diminishing however, as mining and energy companies have increasingly deferred or permanently shelved new investment projects.  Third, the politics of growing income inequality across most developed countries - which has found a credible voice in French economist Thomas Piketty - means that a lift in the corporate tax rate is politically more feasible than other alternatives. 

Beyond a lift in the corporate tax rate, a number of companies with low effective tax rates would be exposed to measures that seek to raise the corporate tax burden, including: CGF, FXJ, QBE, COH, IPL, SEK and CSR (a full list of exposed stocks is available on request).  Infrastructure companies - some of which receive a net tax benefit due to their large depreciation and amortisation charges - should be insulated because governments are unlikely to implement reforms that discourage infrastructure investment. 


The yield trade and the RBA's easing bias: More than meets the eye

The RBA confounded market expectations and left the overnight cash rate (OCR) unchanged at 2.25% at the March meeting, but adopted an explicit easing bias which would have appeased the market somewhat.  Its reluctance to cut rates in consecutive meetings stems from its desire to have more time to assess the impact of its decision to ease policy in February. 

Clearly, it wasn't persuaded to cut again by the unambiguously weak data flow since the February meeting, including the labour force survey and capital spending intentions.

In previous posts (notably, 17th December 2014, Money's Too Tight Too Mention) I suggested that February and May represented the most likely months for policy easing because in an interview in mid-December to the Fairfax press, Glenn Stevens laid the groundwork for lower rates based on a positive narrative.  He was keen to ensure that the markets would not interpret a shift to ease policy as reflecting weak demand, at a time when business and consumer sentiment were still fragile.  A reading of the interview suggested that the slide in oil prices and low inflation would form an integral part of the RBA's positive narrative.

The case for further policy easing has been compelling for some time.  The RBA's patience with the non-mining business sector has been wearing thin for a while.  Through 2014, the RBA implored businesses to invest for growth rather than remain fixated on their costs and internals.  The new normal of capital and cost discipline embraced across the corporate sector has dampened capital spending, to the point where now that the ratio of capex to assets has declined to 1.75%, well below the historical median of 2.2% (see chart).  

The RBA had clearly under-estimated the pervasiveness of this newly entrenched discipline.  Persistent revenue headwinds, a loss of trust in ability of CEOs  to undertake value accretive investments and acquisitions, and investors' insatiable appetite for income has meant that companies increasingly are focussing on trimming operating costs, deferring capex and restructuring to boost profitability.  CEOs with a track record of acquisition led growth no longer command a premium in the market for managerial talent. 

The Agency Costs of Free Cash Flow Have Fallen Considerably

It is a welcome development for shareholders that CEOs are now focussing on what they can control  rather than chasing the pipedream of double digit revenue growth.  Shareholders are exerting a tremendous discipline on companies to return surplus cash flow and in so doing, the agency costs of free cash flow have fallen considerably.  The interim reporting season confirmed that companies continue to lift payout ratios where feasible and more are undertaking buybacks.

But the flipside of the new normal of capital and cost discipline has been sluggish growth.  The economy has effectively been stuck in a nominal recession for three years now, coinciding with the negative terms of trade shock.  The December quarter National Accounts due for release today should confirm that the terms of trade has declined by over 30% from its 2011 peak and that the nominal economy has expanded by less than 4%pa over this time, representing the weakest period of growth since the deep recession of the early 1990s. 

Inflation does not represent an obstacle to lower interest rates.  Growth in unit labour costs - productivity adjusted wages growth - remains weak, private sector nominal wages are growing at their slowest rate on record, there is little sign that the depreciation of the Australian dollar has flowed through to higher prices of tradeable goods, inflation expectations are well anchored, the slide in oil prices pose a downside risk to headline inflation, and there is still considerable slack in the labour market .

Contrary to the RBA's view, it is the role of monetary policy to revive animal spirits, which have been dormant for three years now.  Also contrary to recent statements from Mr Stevens, policy easing at lower interest rates can be just as effective at boosting expectations of growth as policy easing at higher rates.   To the best of my knowledge, there is no theoretical support for the assertion that monetary policy is less potent at lower interest rates.  Further, the large scale asset purchases and forward guidance adopted by the US Federal Reserve, Bank of Japan and other central banks since the financial crisis offers ample evidence that the zero lower bound does not render monetary policy impotent.  Mr Stevens continues to under-estimate the power of monetary policy to revive growth and reduce unemployment.

The Yield Trade: More Than Meets the Eye

Many will interpret the RBA's adoption of an explicit easing bias as a harbinger for further out-performance of high yielding stocks.  At a time when term deposit rates continue to fall, the lure of high yielding stocks - particularly those accompanied by high levels of franking - is compelling.  But on closer inspection, high yielders have endured a period of under-performance in recent years.  Since the end of 2013, the low yielders have delivered an average portfolio return of 24%, well above the ASX200 (16%) and the highest yielding stocks (6%) - see chart.

Valuation theory sheds some light on the poor performance of high yielders at a time when interest rates have declined.  A stock's dividend yield equals the expected discount rate (k) minus expected dividend growth  into perpetuity (g).  Holding g constant, valuation theory says that high yielders ought to be associated with higher risk and higher betas than low yielders.  It so happens that risk assets have fared worse than safe assets in recent years, at a time when investors have eschewed risk from their portfolios; emerging market equities for instance have underperformed and sovereign bond yields around the world have declined to record lows.  Thus, the shift towards safe assets has undermined the performance of high yielders.

Aside from what valuation theory says about the riskiness of high yielders, the pattern of price performance also suggests that investors perceive these stocks as riskier.  The average price performance over the past six months among the high yielders is -11%, well below the low yielders (+1%).  For investors seeking to invest in high yielding stocks with strong price momentum outside of the banks, utilities and REITs, only three candidates meet these criteria: CCL, IFL and JBH.  In a forthcoming report, Evidente will showcase a systematic approach for investors to measure and identify stocks with sustainably high yields.


Tame inflation data and the bond market signal that the yield trade is yet to run its course

As with most macroeconomic releases, there was something for everyone in today’s December quarter CPI.  For the doves, the precipitous fall in petrol prices has pulled down the headline CPI which is around 1.6% higher than a year ago.  For the hawks, the various measures of core or underlying inflation came in stronger than expected, growing by 0.66% in the quarter.  Nonetheless, on a year on year basis, they remain close to the bottom end of the Reserve Bank’s inflation target range of 2-3%.

For the hawks, the inflation data might not offer a compelling reason for the central bank to cut interest rates.  Unlike many other advanced economies, core inflation has not undershot the bank’s inflation target and the fall in the $A/$US cross rate will lead to inflationary pressures in tradeables in coming quarters.  The hawks would also point to concerns that the RBA Governor has expressed about further stimulus stoking speculative activity in housing.

For doves, such as Evidente, the inflation data does not pose an obstacle to further policy easing for an economy that has been stuck in a nominal recession since 2011.  Animal spirits remain dormant and labour market conditions continue to deteriorate.  Record low growth in private sector wages and households’ heightened concerns surrounding job security – which have lifted by 50% in the past three years - point to considerable slack in the labour market (see chart).

Valuations of the yield trade are not exactly stretched

The yield trade has delivered stellar returns for quite some time now.  A portfolio of high yielding stocks with strong earnings predictability or stability has produced a compound annual return of 23% in the past three years, well above the ASX200 return of 15%.  Investors who have been on the right side of the trade are understandably anxious about the prospect that it unwinds against the backdrop of a cyclical re-bound.

But my quantitative analysis suggests that valuations of the yield trade are far from stretched.  The basket is trading on a PE of 15 based on 12 month forecast earnings, which represents a 3% premium to the ASX200.  But at times over the past three years, the basket has traded at significantly higher premiums (see chart).

Record low bond yields are not a harbinger for a cyclical re-bound

Investors concerned about the prospect of a strong cyclical re-bound would be well advised to interpret what the bond market is telling us.  10 year government bond yields have fallen recently to close to a record low of 3%.  This is the lowest level since mid-2012, a period which coincided with the RBA embarking on a series of rate cuts (see chart).  Clearly, bond investors are not pinning their hopes of a strong cyclical rebound anytime soon, nor are they expecting a resurgence in inflation.

The clock ticks on the global yield trade

Given the ECB’s announcement last week to expand and extend its program of large scale asset purchases, the world’s three major central banks are now aligned in their determination to address the shortfall in aggregate demand, reduce the slack in their labour markets, and boost expectations of inflation and nominal GDP.  The clock is therefore ticking on the global yield trade.  But it will be a while before the synchronised actions from the world’s major central banks successfully revive the dormant animal spirits in the corporate and household sectors.

Key action point: For Australia, the tame CPI print, record low bond yields and the fact that valuations of high yielding stocks with strong earnings stability are not stretched, suggest that the yield trade has yet to run its course.

Further rate cuts from the RBA no saviour for domestic cyclicals

Although still in its infancy, 2015 has so far been a frenetic one for central banks around the world, in what has been a series of synchronised (but not co-ordinated) monetary easings.  Central banks in Switzerland, Denmark, Turkey, Canada and Peru have cut their official interest rates in recent weeks, and at the time of writing, the ECB is expected to extend and expand its program of quantitative easing at its meeting on January 22nd.

The Bank of Canada’s (BOC) decision on Wednesday to cut its key lending rate by 25 basis points to 0.75% has lifted investors’ expectations of a rate cut at the RBA’s February board meeting.  Interbank cash rate futures now point to a 30% probability that the RBA cuts rates by 25 bps in February, up from 20% a day earlier.

In this post, I discuss the implications of the BOC’s decision for the RBA’s policy deliberations, suggest that the RBA should reduce the cash rate to 2% by June and undertake quantitative analysis of previous easing cycles which suggests that domestic cyclicals are unlikely to benefit from rate cuts.

How shocking is the terms of trade shock?

The BOC cited the precipitous drop in the price of crude oil as the key reason behind its decision to ease policy for the first time since 2009.  As a major oil exporter – crude oil accounts for 15% of the country’s export basket – the BOC said that the negative terms of trade shock will have an adverse impact on growth in incomes, wealth, and domestic demand, and reduce inflation pressures.

The BOC highlights the multiplier effects of the lower oil price on investment in oil extraction, which accounts for 3% of GDP.  More generally, the oil and gas sector makes up almost one third of Canada’s business investment.  Against this backdrop, the central bank justified the rate cut as providing insurance against these risks materialising.

Both Canada and Australia are small open economies that are commodity exporters.  But the impact of the oil price decline on the two economies is markedly different because while Canada is a net oil exporter, Australia is a net importer of oil.  So what amounts to a negative terms of trade shock for net oil producers like Canada, is a positive shock for net consumers like Australia (albeit a smaller one).

Although crude oil accounts for 4% of Australia’s export basket, oil imports exceeded exports by $25 billion in 2014, which translates into oil trade deficit of 1.5% of GDP (see chart).  A 50% drop in the price of crude oil therefore equates to a positive terms of trade shock of 0.75% of nominal GDP.

For the RBA then, the lower oil price imparts a stimulus to  nominal GDP.  But like Canada, the lower oil price has arrived at a time when core inflation pressures have been trending lower and inflation expectations remain well anchored (see chart).

Oil, inflation and the RBA’s positive narrative

The lower oil price is not the reason why the RBA should ease policy, particularly as a lift in expected global oil production has underpinned the drop in price.  The key reasons have been present for some time.  Australia has suffered a significant negative terms of trade shock since global iron ore and coal prices peaked in 2011. 

During this time, the terms of trade has declined by around 30%, which has underpinned the fact that Australia has remained stuck in a nominal recession for three years.  In all fairness to the RBA, it cannot control commodity prices, but it could have taken a leaf out of the BOC’s playbook and cut interest rates more aggressively as insurance against growing unemployment.

The sharp decline in the oil price however, provides the RBA with a positive narrative to cut interest rates while downplaying the anaemic state of the nominal economy.  In a blog post on December 12th (Money’s too tight to mention) following an interview from the RBA Governor to the Fairfax press, I suggested that Mr Stevens had started to lay the groundwork for more policy stimulus, based on the prospect that a lower oil price would further reduce inflation pressures to below the RBA’s target range of 2-3%.

I argued that the inflation outlook therefore would form an integral part of the RBA’s positive narrative, so the most likely timing of the next rate cut would be February, a week following the release of what is likely to be a benign CPI print for the December quarter.  Expect another rate cut to follow in at the May board meeting, a week following the release of the March quarter CPI in late April.

Rate cuts no saviour for domestic cyclicals

I have undertaken a quantitative analysis of the performance of domestic cyclicals based on the current easing cycle stretching back to late 2011.  Specifically, I track the performance of the media, building materials and discretionary retail sectors around the two last episodes of rate cuts in late 2011 and through most of 2012/13.  Rather than benchmark against the performance of the market, I benchmark domestic cyclicals against domestic defensives (split out into banks and non-bank defensives).

Domestic cyclicals did not outperform in late 2011, at a time when the central bank cut interest rates by a cumulative 50 basis points.  In fact, the domestic defensives outperformed strongly during that time.  The returns of domestic cyclicals in the second period of policy easing in 2012/13 was mixed. Discretionary retail performed strongly, but both media and building materials underperformed the banks and non-bank domestic defensives (charts are available on request).

The chart below shows the performance of domestic cyclicals in recent months, as the market has gradually factored in another rate cut by May 2015.  The performance of interest sensitive sectors has been mixed, with building materials flying, but discretionary retail and media lagging.

The key caveat to the empirical findings is that the analysis is based only on two episodes of rate cuts in the current easing cycle, and thus is vulnerable to the charge of mindless data mining.  But I believe the way the RBA has conducted monetary policy this cycle is markedly different to past cycles.

And therein lies the answer to the puzzle of why interest-sensitive sectors haven’t performed better around RBA rate cuts in the current easing cycle. Perhaps paradoxically, most of the potency of monetary policy lies in the expectations the central bank creates about future monetary policy; and in this cycle the RBA has been far more ambivalent about stimulating growth than it has been in previous cycles.

This has manifested both in terms of the quantum and timing of rate cuts, and in the RBA's language.  The RBA's timidity reflects its concerns around moral hazard, stoking a bubble in property and rapid growth in investor housing lending. Accordingly, rate cuts to date have had little effect in reviving animal spirits in the corporate and household sectors.

To the extent that further rate cuts are associated with the RBA reminding investors of those concerns, this will blunt the announcement effect on interest sensitive sectors, and will do little to revive entrepreneurial risk taking.  Perhaps this time is different; after all, the prospect of rate cuts in Australia is occurring against the backdrop of synchronised monetary easing globally.  But my bet is that this time won’t be different.

Key action point

If the RBA cuts rates twice in 1H15 (as I expect it will in February and May, immediately after the 4q and 1q CPI prints to promote a positive narrative for policy easing), no need to be overweight domestic cyclicals.

The IMF's Patience with the ECB wears thin

Policy makers – particularly those that transcend national borders – normally ensure that they are singing from the same hymn sheet.  But the updated World Economic Outlook (WEO) reveals that the IMF is (rightly) fed up with the ECB’s timid approach to monetary policy.

The IMF argues that monetary policy in the euro area remains slow to respond to the persistent decline in inflation and as a result, the region is vulnerable to any shock that leads to further disinflation or outright deflation.  The IMF urges the ECB to take heed of market expectations, arguing that financial markets are already broadly anticipating further monetary policy (at the forthcoming ECB meeting on 22 January).

The IMF’s frustration with the ECB is understandable because it expects euro area to remain anaemic, growing by a paltry 1.2% and 1.4% in 2015 and 2016, revised down by around 25 basis points from the last WEO update in October 2014.  This on the heels of the euro area expanding by only 0.8% in 2014.

The New Mediocrity and Dormant Animal Spirits

More generally, the IMF appears to have adopted the Larry Summers ‘secular stagnation’ view of the post crisis global economy, which it describes as the ‘new mediocrity.’  This view draws heavily on the Reinhart/Rogoff interpretation of history which shows that recoveries from balance sheet recessions are structural and therefore painfully slow.

The IMF lends support to this view by arguing that the downgrade to the global growth outlook primarily reflects dormant animal spirits;  ‘investment weakness as adjustment to diminished expectations about medium term growth prospects’ and highlights the downside risks to prospective potential output.  In terms of the numbers, the IMF expects the world economy to expand by 3.5% and 3.7% in 2015 and 2016, around 30 basis points lower than in October 2014.

But the IMF’s significant lift to the growth outlook for the US (to 3.6% and 3.3% for 2015 and 2016) should provide a reminder that cyclical factors have played an important role in the slow post-crisis recovery.  Since 2012, the US Federal Reserve has been arguably the most aggressive central bank in its conduct of forward guidance and quantitative easing, an approach which has clearly been informed by the policy errors committed around the Great Depression and recession in 1937.

The divergent growth paths of the United States and euro area in recent years should help to dispel the myth that the monetary policy is ineffective at the zero lower bound.  The counterfactual of tighter monetary policy in the United States would surely have been associated with higher and rising unemployment and slower growth, which the euro area has experienced.

Encouragingly, the IMF endorses the aggressive conduct of monetary policy to reduce the still large output gaps in most economies.  It argues that central banks must remain alert to the possibility that further disinflation does not lead to an additional drop in inflation expectations.  This would surely be a positive for most asset classes thanks to an abundant supply of liquidity.

Please Curb Your Enthusiasm...

The IMF is not alone in downgrading the outlook.  Like many economic forecasters, it has under-estimated the lingering effect of the financial crisis and the timid responses from many central banks.  But the IMF has tended to be too optimistic over the sweep of the past two decades; it has persistently over-estimated world growth over two thirds of the time (a chart is available on request).

Unlike sector analysts who are incentivised to offer excessively optimistic forecasts of company profitability to curry favour with management and garner corporate banking business, it is a puzzle that the IMF’s forecasts have exhibited excessive optimism. 

...but China's Outlook Is Too Pessimistic 

But its forecasts for China look unusually downbeat.  It has downgraded China’s growth to 6.8% and 6.3% in 2015 and 2016, citing the greater willingness of authorities to address the vulnerabilities associated with rapid growth in credit and investment of recent years.  But growth of sub-7% appears to be at odds with the history of growth for a number of Asian economies over the past half century, at a comparable level of China’s development today. 

My yet to be published analysis suggests that growth in GDP per capita of 7.5% is sustainable over the next two decades, underpinned by catch-up as it continues to borrow from already developed technologies and know-how.

Investment Implications - Overweight Safety

As long as the IMF and other economic forecasters continue to downgrade expectations of global growth, investors should be overweight safe assets and defensive sectors within stock markets, particularly companies that offer sustainably high payout yields, and strong earnings predictability. 

Australian stocks that score strongly across screens for payout yield (including capital returned via buybacks) and earnings predictability include: CSL, NVT, AMC, TLS, DLX, WOW, APA, CBA, BXB, SYD and CPU (the full rank of stocks is available on request).


The RBA needs to take 'credit' for debt aversion

The November credit aggregates confirmed that outside of mortgage lending, households and businesses remain reluctant to lift gearing and remain focussed on balance sheet repair.

Business credit expanded by 0.2% in November to be 4.5% higher than a year ago, while personal credit has been stagnant in the past year.  The recovery in personal and business credit since the crisis has been painfully slow.  Business credit has only just reached its pre-crisis peak, while personal credit remains around 10% below its pre-crisis peak (see chart).  That animal spirits in the corporate and household sectors remains dormant suggests that money has been tighter than implied by interest rates being at multi-decade lows.

The only part of the economy where animal spirits are buoyant is housing.  The stock of housing credit is 7% higher than a year ago, driven by owner-occupiers, but mainly investors.  Momentum in investor housing credit remains strong and it is noteworthy that it is 10% higher than a year ago.  Glenn Stevens, the RBA Governor, has previously flagged concerns about this segment growing at double digit rates, given that many of these loans are interest only.

Clearly, concerns that monetary policy ought to lean against the possibility of a bubble in housing continues to occupy the upper echelons of the RBA.  Deputy Governor Phillip Lowe, has previously published work with the Bank of International Settlements, suggesting that central bankers should be wary of large asset price gains when they associated with rapid growth in credit.  Thus the credit aggregates appear to be taking on greater importance in helping the RBA to disentangle fundamentals from speculative elements of asset price inflation.

As long as growth in business credit remains sluggish, bad and doubtful debts are likely to remain low by historical standards, while the anaemic growth in personal lending provides little cheer among discretionary retailers.

Behavioural traps for active managers to avoid (Part II)

In the second instalment of behavioural traps that active managers should avoid, Evidente argues that the costs of over-confidence out-weigh the benefits, recommends that portfolio managers should engage in DIY diversification rather than leaving it to corporates, and cautions PMs to not over-rely on DCF valuations.

In praise of being humble

A number of widely cited studies in the field of applied psychology document the above average driver effect, in which the overwhelming majority of respondents believe that their driving abilities are above average.  Over-confidence or illusory superiority is not confined to self-perceptions of driving ability.  Many people over-estimate their abilities, knowledge and future prospects compared to others.

Terrance Odean and Brad Barber have explored the effects of over-confidence in a financial market setting.  They assert that over-confident investors over-estimate the precision and accuracy of their information, which lifts the likelihood that such investors trade too frequently based on their perceived superior information.  The empirical evidence is not kind to over-confident investors; excessive trading is associated with inferior performance.

Odean and Barber also use over-confidence to link gender with trading performance.  Female portfolio managers have superior track records than their male counterparts thanks to lower churning of their portfolios because they are less prone to suffering from over-confidence.

The key lessons are obvious; PMs ought to be more humble and trade less.  Even when investors believe that they have access to superior information, they should be cognisant of the limits and costs to arbitrage, which can cause mispricing to persist for an extended time.

Ironically, the evolution in the structure of the funds management industry might actually reward over-confidence.  Fund of funds and asset consultants are increasingly shifting towards a core –satellite approach to portfolio construction, where index and smart beta products are combined with high conviction/high tracking error funds.  These funds typically require PMs to have a high degree of confidence in their stock calls, and be willing and able to take large active bets.

Overconfidence probably also contributes to the profitability of the betting against beta trade, which represents the poor returns from high beta stocks.  Overconfident PMs – particularly those working in high conviction funds whose clients expect high returns - are more likely to buy high beta or cyclical stocks to generate outperformance.  The strong appetite for such stocks lifts their price and drives down their expected future returns. 

The world’s most successful investor appears to have intuitively long understood the benefits of betting against beta.  In an academic article published recently (Buffett’s Alpha), researchers attribute Warren Buffet’s superior track record to his willingness and ability to use leverage to lift his exposure to low beta securities.

Don’t outsource diversification to corporates

In recent times, BHP announced a plan to spin-off its non-core assets into a new entity, South32, while Orica has sold its chemicals business to Blackstone after undertaking a strategic review of operations.  These announcements come not long after Amcor and Brambles undertook major restructuring, spinning off Orora and Recall respectively, while Tabcorp and Fosters have also completed demergers in recent years.

The trend towards greater corporate focus has had a long gestation period and is a welcome development.  Long gone are the days where it was common practice for firms to undertake mergers and acquisitions in unrelated industries to boost flagging growth prospects.  Growth prospects for many diversified enterprises have simply not met expectations with the failure stemming from a lack of management focus and the inability of internal capital markets to allocate resources efficiently across often disparate and unrelated business units.

Yet some investors continue to have a strong preference for conglomerates on the basis that diversified firms offer defensive attributes and are not forced to rely on at times fickle capital markets to raise funds.

The tendency to believe that that conglomerates represent ‘safe’ diversified firms stems from the availability and representative heuristics.  Some investors have a high familiarity with the strong track records of better known conglomerates with high profile CEOs, including GE and Wesfarmers, which have shaped investor perceptions about the benefits of corporate diversification (despite the fact that GE has performed dismally since the financial crisis).  From this small but highly influential sample, some PMs extrapolate and assign these attributes to other diversified firms.

The trend towards corporate focus and strong performance from focussed and less complex firms confirms that financial diversification has won over corporate diversification.  PMs who wish to participate in diversification benefits should do it themselves rather than out-sourcing to corporates.

Over-estimate the precision of DCF valuations at your peril

Price targets and DCF valuations have taken on a tremendous amount of importance amongst sell-side analysts over time.  Changes to recommendations are often supported by the price of a stocks being significantly higher or lower than the analyst’s target price, which is typically based on a DCF valuation.

Modelling a DCF valuation can offer a sell-side analyst a competitive advantage.  A detailed and granular model provides scope for sensitivity and scenario analyses, which some PMs have a strong appetite for.

But the long duration of stocks means that DCF valuations are awfully sensitive to inputs used, including the perpetuity growth rate and discount rate.  To illustrate, I use the Gordon Growth dividend discount model (DDM) which says that the price of a stock is equal to its prospective dividend discounted at the rate of the discount rate minus the perpetuity growth rate in dividends.

The standard approach is to use the Capital Asset Pricing Model to calculate the discount rate, which equals the sum of the risk free rate and the product of a stock’s beta and the expected equity risk premium.

The chart below depicts the non-linear relationship of the DDM valuation (vertical axis) to variations in the discount rate (horizontal axis).  The orange line corresponds to a high growth stock, and the blue line corresponds to a low growth stock.  Both stocks are assumed to pay a dividend of $5 in the next period. 

For the low growth stock, a small increase in the discount rate from 6% to 8% is associated with the DDM valuation halving from $250 per share to $125!  The relationship becomes flatter or less sensitive at higher discount rates.  But even a lift in the discount rate from 14% to 16% reduces the DDM valuation by close to 20%.

The steepness of the curve for the high growth stock confirms that the DDM valuation is even more sensitive to changes in the discount rate.  A rise of only 50 basis points in the discount rate to 9% is enough to reduce the valuation by half to $512.  To put the discount rate effect in perspective, subject to the assumptions used for the risk free rate and risk premium, a tiny rise in the stock’s beta from 0.8 to 0.9 is enough to generate a 50 basis point lift in the discount rate to 9%.

Insights from behavioural finance can help shed light on why sell-side analysts continue to rely heavily on DCFs in their decision making process, despite the sensitivity of inputs used.  First, the DCF valuation framework is considered by many to be more intellectually rigorous than other valuation techniques, including price to book and price to earnings ratios.  Second, the availability heuristic causes people to turn their attention to what is directly observable.  It so happens that the output of the DDM is easy to interpret and directly observable, while the inputs are not.  Third, the view that a stock has an intrinsic value helps to anchor our expectations and filter out what we consider to be irrelevant information.  Fourth, when billions of dollars are at stake, stakeholders assign a greater level of precision to DCF valuations than is warranted thanks to the institutional setting.

In short, PMs should be wary of sell-side analysts who bang the table with a high conviction buy or sell call based on their DCF valuation.  Over-estimate the precision of DCF valuations at your peril, particularly for high growth stocks.

Part III 

In the third instalment of this series, Evidente highlights the importance of seeking out independent and alternative sources of information to generate sustainable alpha, argues that price gaps do not necessarily amount to burst bubbles, and warns of the tendency and costs of riding losers for too long and selling winners too early.


Behavioural Traps for Active Managers to Avoid (Part I)

Behavioural finance is the intersection of applied psychology and the behaviour of financial market participants.  The likes of Richard Thaler, Nicholas Barberis, James Montier, Nobel prize winners, Robert Shiller and Daniel Kahneman, and many others have done a tremendous job in elucidating the heuristics or mental rules of thumb that investors (and broking analysts) rely on, which contribute to systematic errors in judgement and decision-making.

Some of these heuristics include: representativeness (leads to extrapolation), availability (leads people to over-estimate the probability of familiar and salient events), anchoring or framing (can distort decision making by affecting a person's frame of reference) and self attribution or over-confidence (people attribute their good performance to skill and judgement, and poor performance to bad luck or factors beyond their control).

Although these errors are not unique to financial market participants, it is reasonable to think that such errors can be costly, particularly when portfolio managers are managing billions of dollars.  If enough investors suffer from such biases they also lead to significant limits to arbitrage, which imposes costs and risks on investors who are less ‘irrational.’

2014 has proven to be another difficult year for active fund managers in Australia and worldwide for cyclical and structural reasons.  The unexpected decline in sovereign bond yields confirms that investors eschewed risk from their portfolios.  Further, the structural shift towards low cost beta like products that commenced since the financial crisis continued, as investors remain sceptical of the ability for active funds to consistently deliver alpha after costs and fees.

At a time when the philosophy of active management is coming under attack as active funds continue to lose market share to ‘dumb’ and ‘smart’ beta products, it behoves PMs to be cognisant of, and avoid behavioural traps.

Hindsight bias

Hindsight bias is better known colloquially to many people (at least in the United States) as the ‘Monday quarterback’ phenomenon.  In the best seller, Expert Political Judgement, Phillip Tetlock argues that hindsight bias amounts to discounting counterfactual scenarios that might have realistically emerged when considered in real time.  He provides compelling evidence that political scientists are prone to look back and believe incorrectly that they had predicted certain outcomes that came to pass.

It is far too easy for fund managers to also fall into this trap because they forget what their views might have been in real time.  After all, financial markets are noisy at the best of times, particularly as the signal to noise ratio is typically low.

There is good reason why financial market participants suffer from hindsight bias.  In an industry where the ability to articulate a convincing story is just as important as track record to growing assets, over-confidence can be a valuable commodity.  But hindsight bias and over-confidence are detrimental to delivering alpha because they limit the ability for broking analysts and investors to learn from past mistakes.

The obvious way for PMs to avoid this behavioural trap is to diligently document their views in real time, which provides scope to look back and benchmark those views with events that subsequently transpired. 

The process can also help to disentangle the role of luck from skill.  For instance, an overweight position in Qantas in early 2014 might have been justified on the prospect of a CEO succession event in the near term.  No such event transpired, but the overweight position has been profitable, based primarily on the precipitous fall in crude oil prices that few had predicted at the start of the year.

The stock market is not a discount store

Profit warnings are a godsend to brokers.  They provide much need volatility and generate trading opportunities largely because they garner the attention of PMs, some of whom like to engage in bargain hunting.  The problem is that the stock market is not a discount store.  The discount store mentality arises due to framing, which distorts the investor’s perspective because they have been conditioned or become accustomed to a higher stock price.  So a profit warning and a sharp fall in price triggers a view that a stock is cheap and thus offers a bargain.

In late 2013, QBE issued a profit warning, citing problems in their North and South American operations, lower than expected investment earnings stemming from the US Federal Reserve’s zero interest rate policy and the persistently high $A.  The stock subsequently fell by over 30%, representing an 8 standard deviation event.  Analysts downgraded their earnings forecasts by around 20%. 

On face value, this amounted to a market over-reaction.  But it is reasonable to think that investors were assigning a higher beta and discount rate to the company’s future growth prospects, thus accounting for the stock’s sharp price decline.  After all, this was another in a long line of profit warnings, the business is a complex and globally diversified insurance company with poor visibility in its far flung operations, and management continue to deal with the legacy of two decades of acquisition led growth.

A number of broking analysts at the time upgraded their recommendation to buy, thanks to the view that the profit warning represented a clearing of the decks of sorts, particularly as it was accompanied by the resignation of the company’s chairperson.  Some of those analysts – influenced by the sharp rise in global bond yields in May 2013 associated with the ‘taper tantrum’ – also believed that interest rates would continue to increase over the course of 2014 associated with a normalisation of US monetary policy, which would be a tailwind for the company's investment earnings.

As it happened, yields subsequently fell sharply in 2014, most of the world’s central banks maintained zero interest rate policy settings, and despite the stock bouncing in the month after the profit warning, twelve months down the track, QBE has performed broadly in line with the market (see chart).

Who’s afraid of stocks trading at a 52 week high?

Price momentum is one of the most widely studied and robust pricing anomalies documented in equities and other asset classes, across time and countries.  Stocks that perform well over six to twelve months tend to continue to yield strong returns for up to six months.

Journal research from the United States provides an interesting twist on the momentum anomaly; stocks trading at or close their 52 week high continue to yield strong returns in the short-term. 

The authors offered a behavioural explanation; many investors are put off by buying such stocks due to concerns that the horse has bolted; a corollary of the discount store framing.  An institutional explanation might also be at play.  Portfolio managers may believe that they have reputational risk to manage if they buy a stock at its peak and it subsequently under-performs, based on concerns at being seen to be swayed by investor sentiment.

My back-testing work for Australia over the past decade shows that stocks trading at or near their 52 week high have continued to outperform in the short term, and 2014 was no exception.  An equal weighted portfolio spread across the 15 large cap stocks trading at a 52 week high at the end of 2013 has yielded a total return of 6.7% year to date, well above the 4.5% from the ASX100 index.  A number of stocks underpinned the outperformance: RHC, SEK, TAH, TLS and AMC, while the key drags were NVT and TPI.

Given that investors eschewed risk in their portfolios over the course of 2014, it is little surprise that the current basket of stocks trading at or near their 52 week high has a strong defensive theme: CTX, GPT, RMD, TLS, TCL, SYD, ANN, COH, NVN, SKI, IPL, APA, ORA, CBA and RHC.

Do not be seduced by a company’s growth prospects and the art of storytelling

A cornerstone of behavioural economics and finance is that we rely on heuristics or rules of thumbs to help us deal with information overload, since humans can absorb and process only so much information.  Financial markets are an apt setting to investigate these heuristics because portfolio managers are confronted with tremendous amounts of information, much of which is noise.

Story telling iss an effective way to help people to make sense of their world, as well as process and communicate information.  People can relate to stories, they can benchmark the stories of others with stories of their own, and stories garner people's attention.  Many CEOs understand this and are able to articulate a compelling story to buy their stock based on the prospect of strong growth.

Buying a basket of stocks with high expected growth in profitability at the end of 2013 has yielded an equal weighted return of over 10% year to date, well above the index return.  But this represents the exception; these stocks have typically delivered dismal returns over the sweep of the past decade (chart is available on request).  The third quartile or mid-growth stocks represents the sweet spot.

The poor returns from high growth stocks is not unique to Australia; the high growth anomaly is robust across the United States and other countries.  The poor performance reflects a number of factors.  Seduced by the prospect of strong growth and possibly some compelling storytelling, investors are lulled into over-paying for future growth.  Second, broking analysts and PMs tend to extrapolate past growth too far into the future.  Third, investors under-estimate the level of risk and uncertainty associated with high forecast growth.

Conversely, the mid-growth stocks are perceived by many to be dull, offering the prospect of little capital growth, and pay out high dividends due to limited growth opportunities.  Because they do not provide as a compelling story as the blue sky embedded in high growth stocks, PMs are prone to under-pay for these attributes.

At present, stocks with high forecast growth (stocks to avoid) are: ILU, OSH, ALL, CSR and BSL, while mid-growth stocks (stocks to buy) include: ANN, TLS, PRY, SGM and TAH.

The illusion of control and the (limited) influence of CEOs

Individuals - particularly those that are over-confident - typically over-estimate the control they have over events, and discount the role of chance or factors beyond their control.  Since many financial market participants are over-confident, PMs need to be careful that they do not over-estimate the importance of management quality on company performance.

Many PMs like to showcase their ability to identify and only invest in companies with good quality management.  CEOs are the custodians of shareholders’ funds, so skilled managers whose interests are aligned with shareholders ought to be necessary conditions for a company to deliver sustainably strong returns.

But factors beyond the control of the CEO and management affect the profitability and performance of a stock, including the state of the domestic and global economy, outlook for interest rates, the supply and demand for credit, shifts in technology and consumer tastes, unexpected changes in the regulatory environment, health of the banking system, and investor sentiment, just to mention a few.

Sydney Airport (SYD) demonstrates that good quality management can have little bearing on a stock’s performance.  SYD is a monopoly asset that generates highly predictable cash flows, with limited exposure to the economy primarily through passenger numbers. 

Shifts in the $A are broadly neutral for passenger numbers; a fall in the currency this year encouraged a lift in overseas arrivals but reduces the number of Australians travelling abroad.  Passenger numbers in the past have been adversely affected by factors beyond the control of management, including the spread of the SARS virus and the s11 attacks.

More recently, the strong outperformance of the stock reflects factors that have little to do with management: the strong appetite for safe assets, subdued top line growth for most companies thanks to the economy remaining stuck in a nominal recession, the decline in sovereign bond yields and continued strong performance of the yield trade.

PMs should not entirely discount the role of management and the incentives they face as a guide to the alignment (or non-alignment) of interests with those of shareholders.  But they should not discount the role that systematic factors outside of a CEO's control play, in driving stock performance.

Part II

In the second instalment, Evidente will discuss other behavioural traps for active managers to avoid, including: over-estimating the precision of DCF valuations, dangers associated with neglecting the regulatory and fiscal landscapes, the problems of chasing down answers to questions that don't matter, and the importance of seeking out alternative and objective sources of information.

Reinhart and Rogoff Continue to Cast a Shadow

A number of years ago, Carmen Reinhart and Kenneth Rogoff wrote the best seller, This Time Is Different: Eight Centuries of Financial Folly, which showed that highly indebted governments were associated with prolonged slow economic growth.  The book’s main theme resonated around the world due to the then unfolding European sovereign debt crisis in 2011.  Since then, governments worldwide have been reluctant to use fiscal policy to stimulate their economies which has put the onus on monetary policy to help overcome the global shortfall of aggregate demand.

The Government’s Mid-Year Economic and Fiscal Outlook (MYEFO) is a timely reminder that Australia, like most other advanced economies, is suffering from deficient demand and as a result, remains stuck in a nominal recession.  The Commonwealth Treasury has slashed its forecast for nominal GDP growth in 2014/15 to 1.5% (from the Budget estimate of 3%), and marginally downgraded the growth forecast for 2015/16 to 4.5% (from 4.75%).

If the estimate for 2014/15 comes to pass, it would be the fourth consecutive year of sub-4% growth, effectively dragging the economy into another year of a nominal recession, the longest such stretch since the economy shifted to a low inflation regime from the early 1990s (see chart).

The Treasury has consistently over-estimated the outlook for nominal GDP for over three years now, and obviously been surprised by the extent of the slide in prices for Australia’s key commodity exports (see chart).  The terms of trade – the ratio of export to import prices, which represents a measure of a country’s purchasing power – has declined by one quarter from its 2011 peak, which in a mechanical sense, has slowed growth of nominal GDP.

The Reserve Bank has clearly been frustrated by the persistently strong currency.  In the face of the 25% decline in the terms of trade, the Trade Weighted Index has fallen by only 15%.  So the currency hasn’t performed its shock absorbing role in response to the negative terms of trade shock as well as in the past.

A number of factors have underpinned the currency’s resilience: the safe haven status that the $A offers at a time when global investors have had an insatiable appetite for safe assets, and Australia’s still large interest rate differential; Australia continues to have among the highest policy rates across the developed world at a time when world’s major central banks have maintained a zero interest rate policy.

The Reserve Bank has little power over the prices of the country’s commodity exports, but should have used monetary policy more proactively to boost growth in nominal GDP, by reviving animal spirits in the corporate, household and even the public sectors.

The economy’s nominal recession has suppressed growth in the key nominal variables, notably tax receipts, company revenues and employee compensation.  Per capita tax receipts collected at the Commonwealth level has grown at an annualised rate of 4.3% since 2010, well below the 6% compound annual growth over the preceding two decades.  Given that the cyclical environment is unlikely to be supportive, the Treasury’s forecast of a lift in compound annual growth of tax receipts to 5% over the next four years looks a touch too optimistic (see chart).

The two charts below confirm the extent of slowing in per capita company revenues and employee compensation in recent years.  No wonder then that consumer and business confidence have remained fragile for an extended period.

If the economy is going to pull out of its long nominal recession, the Reserve Bank should no longer under-estimate the power of monetary policy to revive animal spirits in the corporate, household and public sectors.  Because its timid approach to ameliorating the effects of the negative terms of trade shock  – stemming from concerns over house prices and rapid growth in lending for investor-housing – has imposed a significant cost to the broader community in terms of lower growth in tax receipts, company revenues and employee compensation

The Reinhart/Rogoff thesis still casts a shadow over the pro-active use of fiscal policy and the ability for governments to lift debt to finance capital spending.  This has encouraged governments in Australia to undertake privatisations to raise funds and retain their credit ratings.

The Federal government faces a delicate task between not further undermining already fragile consumer and business confidence in the short-term, but putting their financial positions on a sustainable footing over the longer run.  Further rate cuts accompanied by more aggressive rhetoric from the Reserve Bank would offer the government more wiggle room by lifting growth in nominal GDP and tax revenues.

Looking through the prospect of any cyclical recovery in tax receipts, a lift in the corporate tax burden is probably inevitable to assist in the government's medium term strategy of fiscal consolidation, particularly at a time when the growing political influence of retirees will limit the ability to reform healthcare entitlement spending.  

Portfolio managers should therefore be cautious about stocks and sectors that are exposed to greater tax regulatory risk.  To that end, Evidente will examine those stocks with low effective tax rates in a forthcoming blog post.


Money's too tight to mention

In May this year, Evidente wrote an article published in the Fairfax press which drew parallels between the Reserve Bank’s much anticipated recovery in capital spending by the non-mining sectors and Samuel Beckett's play Waiting for Godot, in which the two protagonists wait for Godot under a willow tree, where he said he would meet them.

By the end of the final act, Estragon and Vladimir's optimism and anticipation remain palpable, yet Godot's arrival is no more imminent than it was at the beginning of the play.  Rarely has such patience been so unrewarding.

Seven months down the track and regrettably, the RBA still finds itself in the same predicament.  That much is evident from the growing chorus of economists calling for easier policy, the increased frequency of the term ‘income recession’ to describe the state of the economy, the slide in prices for Australia’s key export commodities, iron ore and coal, and the fact that animal spirits remain dormant in the business and household sectors.

Mr Stevens highlights the fact that since the RBA started to ease three years ago, it has brought the cash rate down to its lowest level in his lifetime on a sustained basis, and he believes that borrowing costs do not represent an obstacle to the recovery.  He re-iterated that it is now up to the corporate sector itself to regain the psychology of risk taking and invest in projects for future growth.

There a number of issues worth exploring in more detail here.  First, economist and author of the Money Illusion blog, Scott Sumner, draws attention to the work of Milton Friedman who argued that low interest rates – whether measured in nominal or real terms – do not mean that policy is easy.  Rather, low interest rates are an indication that money is tight.  In other words, focus on the reason why interest rates are so low.  In the case of Australia, it is because the economy has been stuck in a nominal recession for three years now (see chart below which depicts annualised growth in nominal GDP).

Second, Mr Stevens continues to under-estimate the power of monetary policy to revive the corporate sector’s animal spirits.  From a capital budgeting perspective, the effects of the compounding effect of a lower risk free rate can be powerful.  But arguably, the monetary policy transmission mechanism is more powerful via the impact on the other part of the discount rate, the expected equity risk premium (ERP).  It is reasonable to think that the amplitude in the ERP is far larger and more important driver of changes to discount rate than shifts in the risk free rate.  And monetary policy can also help to boost expectations of revenue growth and cash flows.

Indeed, the capital budgeting framework sheds light on why money remains tight.  Greater uncertainty - reflected in a persistently high ERP - and expectations that revenue conditions remain subdued, are contributing to the corporate sector's reluctance to invest (and hire).  The deterioration in labour market conditions is evident from the rising unemployment rate and the fact that unemployment expectations are 50% higher than three years ago, around the start of Australia’s nominal recession (see chart).

A positive narrative for a February rate cut

Mr Stevens has devoted most of the this year to developing the central bank’s own forward guidance that an extended period of interest rate stability represents the optimal policy setting.  He has cited concerns around stoking a bubble in house prices and rapid growth in lending for investor housing as reasons for being prudent.

The central bank is clearly mindful that cutting further would exacerbate these concerns and also signal that the outlook had deteriorated materially, particularly at a time when consumer and business sentiment remains fragile.  Thus Mr Stevens has started to lay the groundwork for what he describes as a positive narrative for abandoning the bank’s own forward guidance.

This foundation focusses on the prospect inflation pressures remain well contained and that inflation does not present a barrier to a lower cash rate.  Low wages growth is suppressing unit labour costs – productivity adjusted wages – and the sharp pull back in the oil price will help to ameliorate the inflationary impact of dollar depreciation.

Mr Stevens is surprisingly upbeat about the prospects for global growth of the sharp fall in crude oil prices.  While it is difficult to disentangle the supply and demand dynamics in real time, it is reasonable to think that lower global growth expectations have contributed to lower prices (along with a lift in expected production stemming from the North American supply boom).  Although oil importing nations stand to benefit at the expense of oil exporters, it is difficult to assess the net effect on global growth of these shifts in expected demand and supply.

Given that the inflation outlook will form an integral part of the RBA’s positive narrative, the most likely timing of the next rate cut is February, a week following the release of what is likely to be a benign CPI print for the December quarter.

A change in mindset for portfolio construction

Economists and portfolio managers are no doubt re-assessing their portfolio construction in light of the prospect that the RBA might deliver more rate cuts in the new-year.  But I believe that a better starting point is to acknowledge that money is, and has been, too tight for at least three years now and that this has contributed to Australia’s nominal recession.

This starting point can help to explain a number of patterns in the stock market and corporate landscape market in recent years: slow growth in nominal GDP, persistently weak revenue conditions, corporate restructuring, a trend towards greater corporate focus (thanks to the demerger wave), rising unemployment, investors’ growing appetite for dividends, and the strong and sustained performance of the yield trade.

Even with the prospect of another rate cut (or two) in 2015, my expectation is that the RBA will be the reluctant rate cutter, which will undermine the potency of policy to revive animal spirits.  Against this backdrop, Australia will likely remain stuck in a nominal rut and the stock market trends that have prevailed for the past three years are likely to persist.  Mr Stevens is discovering that being too patient comes at a very high price.

Australia's nominal recession: No end in sight

The media and economists have started to describe the Australian economy as having entered an income recession.  The fact is that Australia has been stuck in a nominal recession for three years now.  During that time, nominal GDP (which in effect is the sum of real GDP, domestic inflation and the terms of trade) has grown at a paltry annualised rate of 2.6%.  This represents a weaker outcome over a three year period than even the balance sheet recession of the early 1990s (see chart).

Economists might wish to argue about the benefits of focusing on real GDP, particularly across periods characterised by different rates of inflation.  But low inflation in Australia has persisted for over two decades now, and nominal GDP represents a better gauge for household and business sentiment.  After all, employees earn nominal wages and businesses do not generate inflation adjusted cash flows.  Given that portfolio managers continue to project company cash flows in nominal terms, it remains puzzling that economists remain fixated on real GDP.

Australia's nominal recession is more than just of passing academic interest, because low growth in nominal GDP has underpinned persistently subdued revenue conditions.  Since mid-2011, analysts have downgraded their revenue forecasts for the ASX200, which remains 15% below the pre-GFC peak (see chart).

Given that top-line growth has been so weak, it is little surprise that companies continue to trim costs aggressively, defer capex, undertake restructuring and are becoming more focussed (thanks to the de-merger wave) in order to boost profitability and cater to investors' insatiable appetite for income.  Consequently, the Australian economy has undergone a productivity renaissance over the past three years.  Despite the slowdown in productivity growth in the September quarter, it has grown at an annualised rate of over 3% since March 2011, growth not seen since the golden period of the late 1990s and early 2000s (see chart).

HoursWorkedStagnated.jpg

The flipside from the widespread corporate restructuring and greater corporate focus is that labour market conditions continue to deteriorate.  Aggregate hours worked has now been stagnant for over three years, which is a dismal outcome considering that Australia's population growth has boomed over this time (see chart).

Glenn Stevens, the RBA Governor, has drawn the line in the sand and made it clear that he doesn't see that monetary policy has a role to play in reviving the corporate sector's animal spirits.  The RBA clearly has little influence over the steep decline in commodity prices and the terms of trade.  But at a time when the economy is suffering from a shortfall in aggregate demand, the RBA's timid approach to monetary policy continues to consign Australia to a nominal recession.

Stock picking necessary to add alpha in domestic cyclicals while investors will continue to reward sustainable dividends

Against this backdrop, domestically exposed cyclical sectors - particularly discretionary retail, consumer services and media - will continue to be beset by revenue headwinds.  Investors would be wise to cherry pick those companies in these sectors that would benefit from industry consolidation or those that have low operational leverage (ie. the ability to lift efficiency without undermining their sustainable sources of competitive advantage).  As long as the nominal recession persists, investors will continue to reward companies that have the ability to become more focused, shed underperforming assets and sustainably lift payout ratios.  Despite commodity price headwinds, the big miners are becoming increasingly well placed to return capital to shareholders.


Low interest rates are here to stay, but don't expect stocks to re-rate

In a speech delivered last night, Philip Lowe, Deputy Governor of the Reserve Bank, offered a timely reminder that global imbalances continue to depress rates of return available to savers.  Despite the narrowing of current account balances in the past decade, business investment intentions continue to fall short of desired saving.  Faced with the prospect of getting low returns from their deposit accounts, savers continue to look for better returns elsewhere and in the process, have lifted the demand for, and prices of other assets.

Indeed, the persistence of low long term interest rates around the world continues to confound the forecasts of many economists and analysts.  Sovereign bond markets around the world have rallied this year with the yield on US 10 year treasuries declining to below 2.5%.

The bond conundrum and the global saving glut a decade on

Low long term interest rates have had a long gestation period.  Almost a decade ago, Alan Greenspan, the then chairman of the US Federal Reserve, remained puzzled by persistently low US treasury yields at a time when the central bank was lifting official interest rates.

A month later in March 2005, Ben Bernanke attributed unusually low long-term real interest rates to a glut of global saving; an excess of desired saving over business investment intentions.  Alternatively, others described this phenomenon as a manifestation of global imbalances; countries like the USA were running a large current account deficit while Asia and the oil exporters were running large current account surpluses.  An abundance of financial capital meant that there was too much saving chasing too few business investment opportunities.  The price of money or long term interest rates subsequently declined.

The global saving glut had its antecedents in a number of financial crises in 1990s spanning Latin America and Asia, which encouraged governments in emerging economies to save more for a rainy day.  The boom in oil prices also boosted the coffers of oil exporters.  Emerging markets therefore swung from being modest net borrowers of capital in 1996 to being significant net lenders from the early 2000s.

While global saving grew rapidly, there was not a commensurate rise in business investment intentions, which exacerbated the imbalance between saving and investment.  Following the end of the dotcom boom in 2000, the sharp decline in stock prices dampened the appetite of firms to commit to new projects.  The resulting excess liquidity found its way into various assets, notably US treasuries, stocks and mortgage backed securities.

Where have all the safe assets gone?

The global financial crisis lifted the appetite for safe assets precisely at the same time as reducing the available supply of credible safe assets.  The precipitous fall in US home values and collapse of the sub-prime mortgage market made investors wary that US housing was no longer a one way bet.  The market for US treasuries in particular benefited from its safe haven status and liquidity, which continued to attract strong demand from foreign central banks and governments.

Ricardo Cabarello from MIT draws an analogy between safe assets and parking slots to explain why long term interest rates have remained low.  A rise in the number of cars and reduction in available car parks raises the price of parking slots.  Similarly, the financial crisis caused the demand for safe assets to grow sharply and US treasuries were seen as one of the few remaining safe haven assets in the world.

On the investment front, the financial crisis dulled the business sector’s appetite for risk and ushered in an extended period of capital discipline and cost restraint, thus raising companies’ propensity to either hoard cash or pay out higher dividends to shareholders.

Global imbalances have diminished, but...

The IMF has recently re-visited this topic and shown that global imbalances have diminished since peaking in 2006.  Current account surpluses and deficits have narrowed markedly in the past decade; the sum of the absolute values of current account balances has shrunk to 3.6% of world GDP from 5.6% in 2006.  Over this period, the aggregate imbalance of the top 10 deficit countries has dropped by nearly half to 1.2% of world GDP from 2.3%, while the aggregate imbalance of the top 10 surplus countries has declined by one-quarter to 1.5% of world GDP from 2.1% in 2006.  A substantial drop in domestic demand amongst the deficit countries since the financial crisis has been a key driver of their lower deficits.  Nonetheless, at 3.6% of world GDP, the sum of the absolute values of current account balances remains well above the levels that prevailed from 1980-2003. 

The scale of the financial crisis suggests that the healing process is far from over.  Corporate, household and public sectors around the world continue to undertake balance sheet repair, while the slow recovery in nominal GDP across many countries continues to dampen the corporate sector’s appetite for debt, capital investment and new hiring.

Monetary policies in developed countries ought to remain accommodative to address the shortfall in global aggregate demand, revive animal spirits and encourage less saving and more spending, particularly as inflation continues to undershoot central bank targets and cyclical unemployment remains high in most countries.

I’m surprised that the Reserve Bank continues to express frustration at the absence of entrepreneurial risk taking and growth plans across corporate Australia.  After all, top-line growth is weak because the economy remains stuck in a nominal recession; nominal GDP has grown at or below 4% pa in each of the past two financial years, the worst outcome since the early 1990s.  Company results and guidance confirm that animal spirits remain dormant which continues to hinder the much anticipated handover of mining to non-mining capex.  Beset by anaemic revenue conditions, companies justifiably continue to boost profitability by undertaking restricting, selling off underperforming assets, trimming costs and deferring capital spending, and abandoning growth options altogether.

A world of low expected growth and returns = High payout but not higher multiples

Although the reduction in the size of global imbalances is a welcome development, the global saving glut remains with us; excess of desired saving over business investment intentions persists.  This is what bond markets are telling us.  But low interest rates do not necessarily translate into a re-rating of stocks.  From a capital budgeting perspective, the spot risk free rate is low thanks to the factors that are restraining corporate investment: low expected nominal growth and a high expected equity risk premium (ERP).  Therefore, stock multiples should not get an assist from a lower risk free rate given a higher ERP and lower growth prospects .

In a world of low expected capital growth and low expected returns, investors will continue to demand that companies return capital in the form of buybacks and dividends (see my earlier research report, The Cult of Equity).  This obviously does not represent a permanent state of affairs going forward.  Eventually, persistently high payout rates and low retention rates will sow the seeds of the next investment boom as profitable opportunities become more abundant and expected returns from capital expenditure increase.  But the current level of sovereign bond yields around the world and the ECB's timid approach to monetary policy suggests that this remains a way off.

* The charts underpinning the analysis are available on request.

A bright outlook for China's growth prospects and commodities demand

Pessimism is de rigueur among commentators regarding the prospects for China's economy.  GDP growth has slowed from double digit rates to 7.5% in recent years, while prices across most hard commodities continue to slide.

But the Reserve Bank has weighed into the debate with a timely reminder that the long term outlook for Chinese demand for iron ore and steel is bright, underpinned by growing steel intensity in household consumption and residential construction, while China's per capita energy consumption remains low by the standards of advanced economies.

Historically, investment has been steel intensive relative to household consumption.  But as cities grow and incomes rise, steel demand associated with motor vehicle ownership - which remains very low by the standards of advanced economies - should increase (see chart).

Greater motor vehicle ownership will add indirectly to the construction of underground car parks in apartment and commercial buildings.  As the process of urbanisation continues, the construction of taller buildings to accommodate more city dwellers will also lift steel demand.

China's per capita energy consumption remains low by international standards.  The fact that coal dominates China's energy usage is clearly contributing to greenhouse gas emissions and air pollution in most of the country's major cities.  The chart below suggests that there is plenty of scope for renewables, oil and nuclear energy to displace coal over time.

In the short-term, concerns about credit bubbles, the opacity of the financial system, renewed weakness in residential and commercial property markets and the extent to which environmental controls impose constraints on China's growth path will provide plenty of fuel for the pessimists.

While the Reserve Bank communication today didn't address the question of China's sustainable long term growth prospects, there are reasons to be the optimistic thanks largely to catch-up.  At comparable levels of development to China - in terms of GDP per capita relative to the United States - Korea, Taiwan and Japan continued to experience rapid growth for decades.

The pessimists might be winning the battle at present, but there are good reasons to be optimistic about China's longer run growth prospects and demand for commodities, even as the economy re-balances towards more household consumption.

Rumours of the yield trade's demise are greatly exaggerated

In a wide ranging speech given overnight, Glenn Stevens, the Reserve Bank Governor, gave the clearest indication yet that he will not lift the Overnight Cash Rate for an extended period.  The historically low interest rates are justified on the grounds that the economy still has excess capacity and that inflation is likely to remain under control over the next couple of years.

The fact is that Australia has remained stuck in a nominal recession for over two years.  Nominal GDP growth has not risen above 4% pa in each of the past two financial years, the worst outcome since the early 1990s (see chart).  No wonder that consumer confidence remains in the doldrums, revenue growth is weak and animal spirits in the corporate sector are still dormant.

Mr Stevens continues to lament the absence of entrepreneurial risk taking.  While he acknowledges that firms are waiting for more evidence of stronger demand, he suggests that the stronger demand should come from them.  This strikes me as somewhat circular.

Recent communications from the RBA indicate that it is puzzled that non-mining investment remains weak when corporate cash balances are high, gearing is low and Tobin’s q ratio has been growing.  That is, the market value of assets has been growing faster than the replacement cost of assets.

But the value of assets has been rising precisely because companies – beset by persistently weak revenue conditions and weak nominal GDP growth – have been boosting profitability by pulling back rather than expanding.  Gone are the days of chasing the pipedream of double digit revenue growth.  CEOs are now focussed on trimming costs aggressively, restructuring, shedding non-performing assets and deferring or completely abandoning capital projects to cater to investors’ insatiable appetite for income.  Mr Stevens can implore companies to take on more risk but this will continue to fall on deaf years.  The prospect of persistently subdued top line growth suggests that a revival in the corporate sector’s animal spirits is a way off (see chart).

Mr Stevens acknowledges that corporate business models in Australia have effectively been responding to various headwinds – including a high exchange rate – by restructuring and lifting efficiency, and that this has led to a pick-up in growth of productivity.  Indeed, Australia’s productivity renaissance has been evident for a while now (see chart).

Mr Stevens continues to advise caution on the outlook for house prices: prices have risen considerably in Australia’s largest two cities for a while now, they have growing faster than incomes by a decent margin and mortgage lending to investors has registered double digit growth.  Further, the RBA Governor highlights that house prices go up AND down (his capitals, not mine). 

Rightly or wrongly, one of the lessons that the RBA has taken from the past decade is that central banks should no longer be passive actors during periods of asset price inflation, particularly when these episodes are associated with rapid growth in credit.

Mr Stevens faces the dilemma that animal spirits in investor housing is buoyant (which according to the RBA poses a growing systemic risk) while animal spirits remain dormant in the corporate sector.  As long as the RBA continues to under-estimate the power of monetary policy to revive the corporate sector’s animal spirits, the Australian economy will remain stuck in a nominal recession.

From a portfolio construction perspective, this means more of the same and bodes well for the yield trade.  For a number of years now, analysts have been upgrading the growth prospects for large cap, defensive, high yielding stocks relative to cyclical stocks (see chart). 

The tailwind from declining bad & doubtful debt charges will no longer boost bank sector earnings going forward.  Nonetheless, in an environment of low nominal GDP growth and subdued revenue conditions, analysts are unlikely to materially lift their earnings forecasts for cyclical stocks.  Australia’s under-capitalised banking system represents the key risk to the yield trade, but that is not actionable at a time when growth in business credit remains anaemic.

Mea Culpa: Higher capital requirements = Higher bank dividends

In my recent blog post, Too Big To Fail (And Offend), I argued that the politics of banking were such that the bite of the Murray inquiry would be less menacing than its bark, consistent with the experience of financial sector reforms in other countries since the financial crisis. 

One of the reasons I suggested that the government would be reluctant to lift capital requirements substantially was due to their concern that the banks would cut back their dividends, which account for almost one-third of total dividends paid by the ASX200 companies.  In dollar terms, this translates into a chunky $20 billion paid out to bank shareholders in the past year alone.  Any government would be concerned about being blamed for banks cutting back on dividends by self funded retirees and self managed super funds loaded up on high yielding bank shares.

Well, I was wrong on the 'negative' link between bank capital and dividends.  Charles Hyde from Macquarie University has kindly pointed out that forcing banks to finance their loan books with more shareholder equity or loss absorbing capital does not mean that banks need to cut back on dividends.  Contrary to conventional wisdom, bank capital is not an asset; it does not sit idly in a bank's vaults, unlike reserve requirements.  Rather, it is a liability, which together with customer deposits and wholesale debt, is used to finance a bank's loans. 

The key function that a bank performs is maturity transformation.  It carefully manages its liabilities which are liquid with a short duration, and its loans which are illiquid and typically have long duration.  If a bank uses more shareholders equity in its liability mix, in no way is it forced to cut back on loans or dividends.  On the contrary, it can use those additional funds to lend to the household, business and government sectors.  Unfortunately, the terminology used is confusing; capital regulation is a regulation of a bank's liabilities, not its loans or assets.

The causal link between bank capital and dividends might actually run in reverse; that is, more capital enables a bank to pay shareholders sustainably higher dividends.  A bank that holds more loss absorbing capital is more resilient to a decline in the value of its loans, possibly brought about by an economic downturn.  Though the economic cycle, insiders of safe banks should therefore have more confidence to pay higher dividends than banks with less shareholder equity.

The chart below provides strong empirical support for the proposition that safer banks actually more dividends.  There is a statistically robust and positive linear relationship between the dividends to assets ratio on the vertical axis and the leverage ratio on the horizontal axis (ratio of common shareholder equity to assets) for the largest 100 global banks. 

The strong and positive linear relationship is not just unique to the most recent annual estimates used; the regression line was very similar when I re-estimated the relationship using annual estimates from three years ago (not shown here).

It is interesting to note that the four Australian major banks all lie well above the regression line.  This might reflect their focus on commercial banking operations, which have been associated with higher profitability and lower cost to income ratios than offshore banks.  Moreover, Australia's status as one of the few countries in the world with a full imputation system encourages companies to pay dividends.  The regression based on annual estimates from three years ago also shows that Australia's banks were well above the line then too, lending support to the view that higher profitability and imputation have contributed to their higher dividend payout rates.

Total Loss Absorbing Capacity

In a welcome development, the Financial Stability Board recently announced that it is seeking consultation for a common international standard for Total Loss Absorbing Capacity amongst global systemically important banks, which demonstrates a greater willingness to tackle the problem of too big to fail.  But if the pace of reforms since the crisis is any guide, the move to a common global standard will be glacial and probably too lenient.

Despite the compelling empirical evidence that higher capital requirements = higher dividends, the politics of banking still favour the major banks, thanks to their size, profitability and concentrated industry structure.  Although the Murray inquiry might be emboldened by the aggressive language used by the Financial Stability Board in its determination to tackle too big to fail, I still expect the inquiry's bite (and the government's response) to be far less menacing than its bark.    


Too Big To Fail (And Offend)

A recent marketing trip revealed that the main concern portfolio managers have at present is around the banks, particularly the noise made about capital in the lead up to the final report of the Murray Inquiry.  Some PMs are convinced that Murray will recommend that the majors lift their capital requirements substantially and that this will crimp their return on equity and future growth prospects, as well as curtail their ability to maintain their payout ratios.

Further stoking those concerns, Wayne Byres, the Chairman of the Australian Prudential Regulatory Authority, has recently drawn attention to the fact that rapid growth in mortgage lending in the past decade – home loans account for 65% of their loan books, up from 55% - has given the banks a tremendous free kick in terms of boosting their capital ratios.  Risk weighted assets, the widely used denominator in capital ratios, has lagged growth in total assets because mortgages attract lower risk weights than business lending (see chart).

Consequently, the alternative (and more robust) leverage ratio – which uses total assets as the denominator - has lagged capital ratios based on risk weighted assets.  In fact, the leverage ratio remains slightly below historical trends (see chart).  The banks have likely engaged in gaming of the risk weighted assets framework to economise on shareholder equity.

LeverageRatio.jpg

The complicated politics of banking

I believe that the Abbott government is pleased that Murray is rattling the cage around banks and capital, without rattling the cage too much.  After all, the methodology used by Murray suggests only a small increase is necessary for Australia’s majors to converge on Core Tier 1 capital ratios of global peers.

Despite the community backlash against the banks (and financial institutions more broadly) in the wake of the financial crisis, the politics of banking favour the major banks; they make generous contributions to both political parties, have well-funded lobby groups and paid out $20 billion in dividends to shareholders in the past year, accounting for one-third of total dividends paid by the ASX200 companies.  Imagine the uproar from self-funded retirees and self-managed super funds loaded up on high yielding bank shares, if Murray recommended a substantial lift in capital which would cause the banks to cut back on dividends.

Also note the government’s decision earlier this year to not implement a key recommendation from the Senate Inquiry into the performance of ASIC, to undertake an independent inquiry into the conduct of the Commonwealth Bank’s financial planning business.  Evidently, the major banks are literally too big to fail (and offend).

I am very sympathetic to the view that the majors need to finance a significantly larger share of their loan books with more common shareholders equity.  The Australian system remains significantly under-capitalised and a crisis of confidence will likely expose the vulnerability that banks simply do not have adequate loss absorbing capital and rely too heavily on borrowed funds in their mix of liabilities (for more detail, see my recent blog post, An open letter to Mike Smith and Lindsay Maxsted).  This represents a key longer-term, not actionable at this point in time.

Despite the noise made around capital, a number of factors should continue to support the sector in the near term.  Valuations don’t look stretched (the sector is trading at a 10% discount to the market, in line with the historical median), the aggregate payout ratio of 70-75% is in the historical range and BDD charges are likely to remain low as long as business credit is weak and animal spirits remain dormant (my base case considering that Australia remains stuck in a nominal recession).  For more detail, see my recent blogpost, The great complacency.

Against this backdrop, I would use any renewed price weakness of the major banks in the lead up to Murray’s final report as an opportunity to take a tactical overweight in the sector.  The first key signpost to shift to a neutral to underweight position in the sector is a re-acceleration of business credit, but that remains a way off while the corporate sector’s animal spirits remain dormant and the ASX200 companies continue to face persistent revenue headwinds (see chart).

Murray Inquiry: More bark then bite

Since the financial crisis, governments and prudential regulators around the world have demonstrated an inability and unwillingness to seriously confront banks about capital and tackle the problem of too big to fail.  There has been little appetite for governments to undertake an upheaval of capital regulation and to protect taxpayers from remaining on the hook for banks' excessive risk taking.  As has been the case with financial sector reform across other countries since the crisis, the bite of the Murray Inquiry promises to be far less menacing than its bark.  Which is a shame, because it will represent a missed opportunity to create a resilient financial system.  That much will become obvious in years to come.