
A salute to corporate Australia
/Many global investors have eschewed Australian stocks from their portfolios for a while now. The high Australian dollar, sensitivity to the slowdown in China's growth and the attendant decline in commodity prices, the fact that the major banks continue to trade on higher multiples than their global peers and growing concerns of a bubble in Australia's residential property markets (particularly Sydney and Melbourne) have conspired to keep cautious global investors on the sidelines.
But the resilience of Australia's corporate sector has confounded most global investors. Aggregate profitability has not declined over the past five years, despite the significant macro headwinds that have curtailed top-line growth. Let's not gloss over just how severe the terms of trade shock has been; not only is the RBA's Commodity Price Index one third lower than five years ago, but the value of the Australian dollar relative to the US dollar has declined by only 10% over this time (see chart).
Corporate Australia has responded admirably by trimming costs aggressively, restructuring, divesting under-performing assets that have been peripheral to their core focus, and deferring capital spending where feasible. No sector has remained untouched, including banks, mining, energy, telcos and retailing. Of course, the macroeconomic consequences of this belt tightening has led to a shortfall in aggregate demand, but that's a problem for the RBA to address, not corporate Australia.

Various measures of Australia wide corporate profitability show that there has been little change over the past five years, including the National Accounts measure of Gross Operating Surplus or forecast EPS for the ASX200 companies. Consequently, forecast EPS remains one-quarter lower than the pre-crisis peak and has significantly lagged forecast EPS for the S&P500 companies, which is 20% higher than its pre-crisis peak. But US companies have not had to deal with a large terms of trade shock and the Federal Reserve has been more determined to stimulate growth than the RBA.
Given that forecast EPS for the ASX200 has remained stagnant for the past five years, multiple expansion has driven the market higher, with the 12 month prospective PE lifting to 15x from 11.5x (see chart).

A decomposition of forecast EPS shows that balance sheet growth has slowed, and that the profitability or ROE achieved on the net asset base has deteriorated to 12% (see chart).

On face value, the important role that multiple expansion has played in the past five years does not point to an optimistic outlook for stocks. The PE ratio of 15x suggests that there is limited upside from further multiple expansion. In other words, it appears that earnings expansion will need to drive the market higher going forward.
But when we turn our focus to dividends, the picture changes somewhat. I am a firm believer that sector analysts over-estimate the control that a company's CEO has over a stock's performance because there are so many factors that shape a stock's returns that are beyond the CEO's control. But there is one key variable that a CEO and CFO can control; payout policy. Many companies have increasingly catered to investors' insatiable appetite for income in recent years by lifting payout ratios.
At a time when expected profitability has stagnated, forecast dividends have grown by over one-quarter in the past five years. Consequently, the payout ratio for the ASX200 companies has lifted to a ten year high of 75% (see chart). I believe that this forms an integral part of the quiet revolution in corporate governance, because companies disgorging cash to shareholders reduces the conflicts of interest that exist between shareholders and managers (see my post from last week).

Some - including the RBA Governor - have bemoaned the absence of entrepreneurial risk taking among Australian companies and implored the corporate sector to invest for growth. But at a time when the world economy is still awash with excess capacity and revenue conditions remain anaemic, why would companies invest in projects at or below their cost of capital? Fortunately, the corporate sector has done the sensible thing and returned capital back to shareholders.
A focus on dividends helps to re-cast the market's rise in the past five years. The 25% growth in expected dividends means that the aggregate DPS is now approaching the pre-crisis peak. Compare this with forecast EPS, which remains 25% below its pre-crisis peak. Indeed, dividend expansion has actually been the dominant driver of the higher market since the dividend multiple has remained broadly steady at around 20x (see chart). In other words, the prospective dividend yield has hovered around 5%.

The key risk to the market in the near term therefore lies in bank sector dividends and the highly concentrated nature of dividends paid. Dividend concentration has increased since 2007, with the top 10 dividend payers generating 60% of total dividends paid by ASX listed companies, up from 43% in 2007 (see chart). As APRA continues to lift capital requirements, bankers will no doubt cry wolf that these measures will dilute their ROEs and reduce their ability to sustain current high payout ratios. But in previous work I have published, I show that banks with more equity capital actually pay higher dividends because they are safer. More generally, I believe that the aggregate payout ratio will continue to increase despite already being at a 10 year high of 75%, particularly as companies continue to find innovative ways to free up cash.

To more recent events - Good news for value stocks
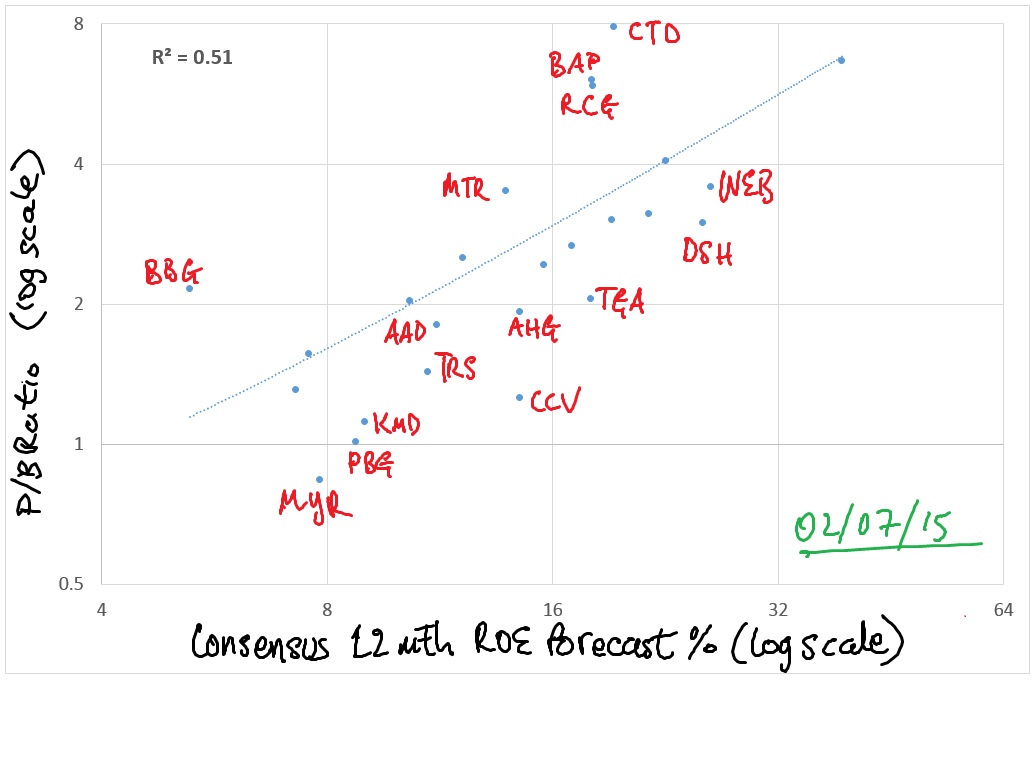
Finally, in the past week, two stocks have bounced: Pacific Brands which revised its profit guidance higher, and Kathmandu, on that announcement that Briscoe, a NZ based retailer would be lodging a takeover offer. In mid-June, I spoke to a number of portfolio managers about discretionary retailers and drew their attention to a chart for the stocks in their sector which plots their P/B ratios against their consensus ROE expectations. At the time, there were three value traps that lay well below the regression line: KMD, PBG and MYR (see chart).

I have updated the chart (see below) and it is noteworthy that despite the fact that both KMD and PBG have re-rated since mid-June, they remain well below the line, suggesting that there could be more upside. It also remains to be seen whether investors will now start to re-assess whether the risk-reward trade-off has improved for other stocks long considered to be value traps, notably MYR.