
Most active management and performance evaluation today just is not well described by the alpha–beta, information-systematic, selection-style split anymore. There is no “alpha.” There is just beta you understand and beta you do not understand, and beta you are positioned to buy versus beta you are already exposed to and should sell. - John Cochrane (University of Chicago)
In an ambitious Presidential address to the American Finance Association, John Cochrane suggested that understanding variation in discount rates (in the time series and cross section) ought to be the key guiding principle to asset pricing research. In this post, Evidente draws on Mr Cochrane's insights and shows that a fall in risk premia and discount rates can account for a number of recent financial market phenomena, and also shed light on the outlook for monetary policy and alpha-beta separation.
Mr Cochrane starts with the foundation of asset pricing theory; that asset values reflect the sum of expected discounted cash flows. Valuation theory can be re-formulated to show that the dividend yield (for the purposes of this post, I focus on the S&P 500 index) equals the discount rate minus the expected perpetuity growth in aggregate dividend per share. This identity says that a fall in the S&P 500 dividend yield reflects a decline in expected stock returns and/or a lift in expected growth in DPS.
Like Mr Cochrane, I chart the time series of the S&P 500 dividend yield against seven-year ahead returns (see below). The yield is multiplied by 4 to allow the use of the same scale. Eyeballing the chart, this is not a one for one relationship, but encouragingly the sign of the relationship appears to be in the right direction; episodes of high yields (ie. low prices) are associated with high seven-year ahead returns from the S&P 500.

The chart of the S&P 500 dividend yield against seven-year growth in DPS doesn't seem to line up so well with valuation theory (see below). For most of the 1970s and 1980s, seven-year ahead DPS growth trended downwards at a time when the yield was also falling; valuation theory predicts an inverse relationship. Moreover, from 2003 to 2011, DPS growth accelerated while the dividend yield also rose.

Valuation ratios reflect expected returns, not expected growth
Mr Cochrane's econometric analysis confirms that regressing seven-year ahead market returns against the S&P 500 dividend yield produces a positive and statistically robust coefficient, consistent with valuation theory. In contrast, regressing seven-year ahead dividend growth against the dividend yield produces a small and statistically insignificant coefficient, which has the wrong (ie. positive) sign. That is, the data suggest that periods of high yields are associated with high expected dividend growth.
Mr Cochrane concludes that all variation in the dividend to price ratio reflects variation in expected returns or discount rates, and that none corresponds to variation in expected dividend growth. High prices relative to current dividends (ie. low yield) entirely predict low returns.
This is the basis for Evidente's view that investors are now condemned to an extended period of low future returns from the S&P 500 companies. The annual dividend yield of 1.7% is now comparable to the level that prevailed during the credit boom, during which annualised seven-year ahead market returns were mid-single digit at best (see first chart).
What has been the source of the drop in the market dividend yield since it peaked in early 2009? In other words, what has contributed to a decline in expected returns during this time? The current 10 year Treasury yield to maturity of 2.7% pa is only slightly below the yield that prevailed in early 2009. The key driver must therefore be a lower equity risk premium. Evidente's proprietary measure of the implied ERP has declined from over 6% to its current level of 2.6%, which is comparable to the eve of the crisis in early 2008 (see chart). I will re-visit the ERP below in the context of monetary policy.

What I have simply done is undertake a decomposition exercise, which shows that since early 2009, a lower ERP (rather than the risk free rate) has been the main source of the drop in expected returns from the S&P 500. This still begs the question of why a lower ERP? Before I explore that, let's trace through the implications of the lower risk premium more recently.
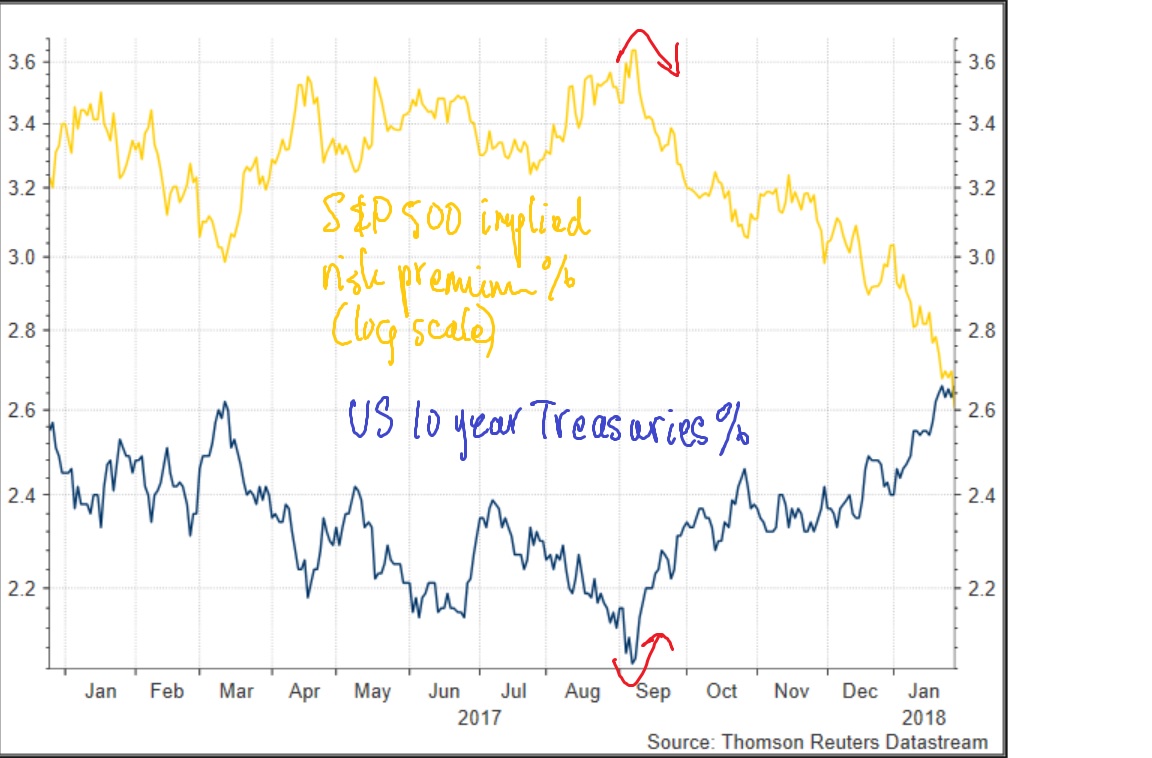
Despite the secular downward trend in the ERP since 2009, there have been bumps along the way. Since early September 2017, Evidente has observed a steep drop in the risk premium from 3.6% to below 2.7%. This has coincided with a lift in the risk free rate from 2% to over 2.6% (see chart). Overall, this corresponds to a net decline in expected returns.
Beware momentum crashes
Despite its empirical shortcomings, the CAPM can offer a framework for understanding the cross sectional implications for stocks from a shift in the ERP. According to the CAPM, a stock's risk premium is the product of its beta and the ERP. If the ERP is falling, then expected returns from high beta securities should experience a larger proportionate decline in expected returns than their low beta counterparts. So cyclical sectors should experience greater multiple expansion than defensive sectors, controlling for expected cash flows. This is in fact, what we have observed across the S&P 500 in the past five months. Cyclical sectors (left panel below) have experienced a bigger lift in their book multiples than defensive sectors (right panel). The exception is technology, which is widely viewed as a defensive sector. So in recent months, shifts in discount rates do a reasonably good job at accounting for variation in sector multiples, without reference to expected cash flows.
I suspect that variation in expected returns can also help explain the profitability of price momentum strategies. To the extent that shifts in discount rates are slow moving, this could produce positive auto-correlation of stock returns in the cross section. Five months since the inflection point, presumably many long momentum portfolios are now populated by cyclical securities. If there is a link between between momentum and discount rates, momentum crashes could emerge when there is a sharp reversal in expected returns. The challenge for momentum investors is either to engage in market timing (difficult) or accept that occasionally they will suffer from large draw-downs. Therefore, beware of gearing up momentum strategies in good times.

Animal spirits recover in the household sector
Having briefly explored some of the investment implications of recent shifts in discount rates, Evidente seeks to now to shed light on the why. Why have expected returns fallen? Drawing on Mr Cochrane's analysis, consumption based models offer some promise here. The key insight is that stocks offer poor payoffs during recessions, when businesses are failing and jobs are being lost. Workers exposed to these real world developments will wish to avoid holding stocks during these episodes. In other words, stocks expose agents to downside risk precisely at a time when they cannot withstand such losses.
Mr Cochrane articulates this phenomenon as follows: If we ask the “representative investor” in December 2008 why he or she is ignoring the high premiums offered by stocks and especially fixed income, the answer might well be “that's nice, but I'm about to lose my job, and my business might go under. I can't take any more risks right now, especially in securities that will lose value or become hard to sell if the recession gets worse.”
The durable goods share (a measure of durable goods consumption as a percentage of total goods consumption) in the United States is a good starting point for a consumption based model that captures this asymmetric risk preference. Households purchase durable goods or long lived items (which are typically big ticket items) in boom times, when they are feeling optimistic or confident about the future. In contrast, they are expected to reduce their consumption of durable goods disproportionately during recessions.
Supporting the consumption based model, the nominal durable goods share has actually fallen sharply during most of the recessions in the United States over the sweep of the past five decades (see chart). I have superimposed the real share as well, which is available since the late 1990s. Both shown that consumers didn't reduce their purchases of durable goods in the light recession of the 2000s. Since then, the real durable goods share tracks financial market developments reasonably well. It grew considerably during the credit boom and its tipping point lines up well with the financial crisis. Since 2010, it has re-bounded strongly to a record high of 40%. Interestingly, in the past year it has continued to increase at the same time that growth in the nominal share has slowed.
This suggests that households feel more confident and optimistic about the future. Perhaps expectations of their future cash flows have increased and/or they are assigning lower discount rates to those expected cash flows. Lower personal or social discount rates may well be connected to the lower equity risk premium noted above, and therefore lower expected returns from stocks.

If households perceive lower risk, this ought to be reflected in lower expected returns from not just stocks, but other asset classes. Consistent with the decline in the ERP, there has been a striking fall in corporate bond spreads, which at present, are at their lowest levels since late 2007 (see chart). Mr Cochrane suggests that return predictability (ie. using variation in valuation ratios to predict future returns) is pervasive across asset classes, with much of the variation in credit spreads reflecting future returns, not default probabilities.

Other applications of time varying discount rates
Capital budgeting and DCFs
Time varying discount rates pose a challenge to traditional capital budgeting and stock valuation models based on discounted cash flows because a constant market premium is almost always used (of around 6%). As if forecast cash flows generate all the variation in price. Yet, here we have shown discount rates appear to account for all the price variation. And as Mr Cochrane highlights, the market premium moves around a lot. He also suggests that analysts, portfolio managers and those engaged in capital budgeting massage their cash flow forecasts up in good times and massage them down in bad times, which compensates for artificially constant discount rates.
Monetary policy
Most of the focus of monetary policy over the past decade has been the the ability for central banks to influence long term interest rates, via the short term policy rate and other unconventional measures such as policy guidance and quantitative easing. Mr Cochrane suggests that this is misplaced. The efficacy of policy ought to be benchmarked against its ability to affect and target risk premiums. Against this backdrop, with the implied ERP now back to levels that prevailed prior to the financial crisis, the Federal Reserve might be encouraged to continue to tighten policy settings.
Alpha-beta separation
Most price momentum strategies appear to earn alpha (before costs) based on traditional asset pricing models. Of course, 'bad model' problem suggests that any test of alpha is as much a test of the asset pricing model you use. If the beta exposures are mis-specified then a what looks like a PM's alpha might simply reflect hidden beta exposure. This is not necessarily bad news for active funds. Just that they probably should be seeking to better understand their exposures to difficult to identify and measure risks, such as time varying discount rates. Mr Cochrane recounts the story that one hedge fund manager told him that 'exotic beta is my alpha'.
Concluding remarks
Drawing on the insights from asset pricing theory, the data offering compelling evidence of time varying discount rates and that variation in dividend yields (and other valuation ratios) reflect changes in expected returns not expected dividend growth. Drawing on the insights of John Cochrane, I have sought to explain the recent boom in stock prices in terms of a lower discount rate and specifically market risk premium. Unlike Larry Summers, there is no narrative here on the growing monopolistic competition in the United States due to the market power and dominance of technology firms, contributing to a higher corporate profit share. Simply that prices of stocks (and other assets) are high because expected returns are low. I believe that this parsimonious framework offers insights into the housing boom across many developed markets (including Australia). But that's for another post.