Tame inflation data and the bond market signal that the yield trade is yet to run its course
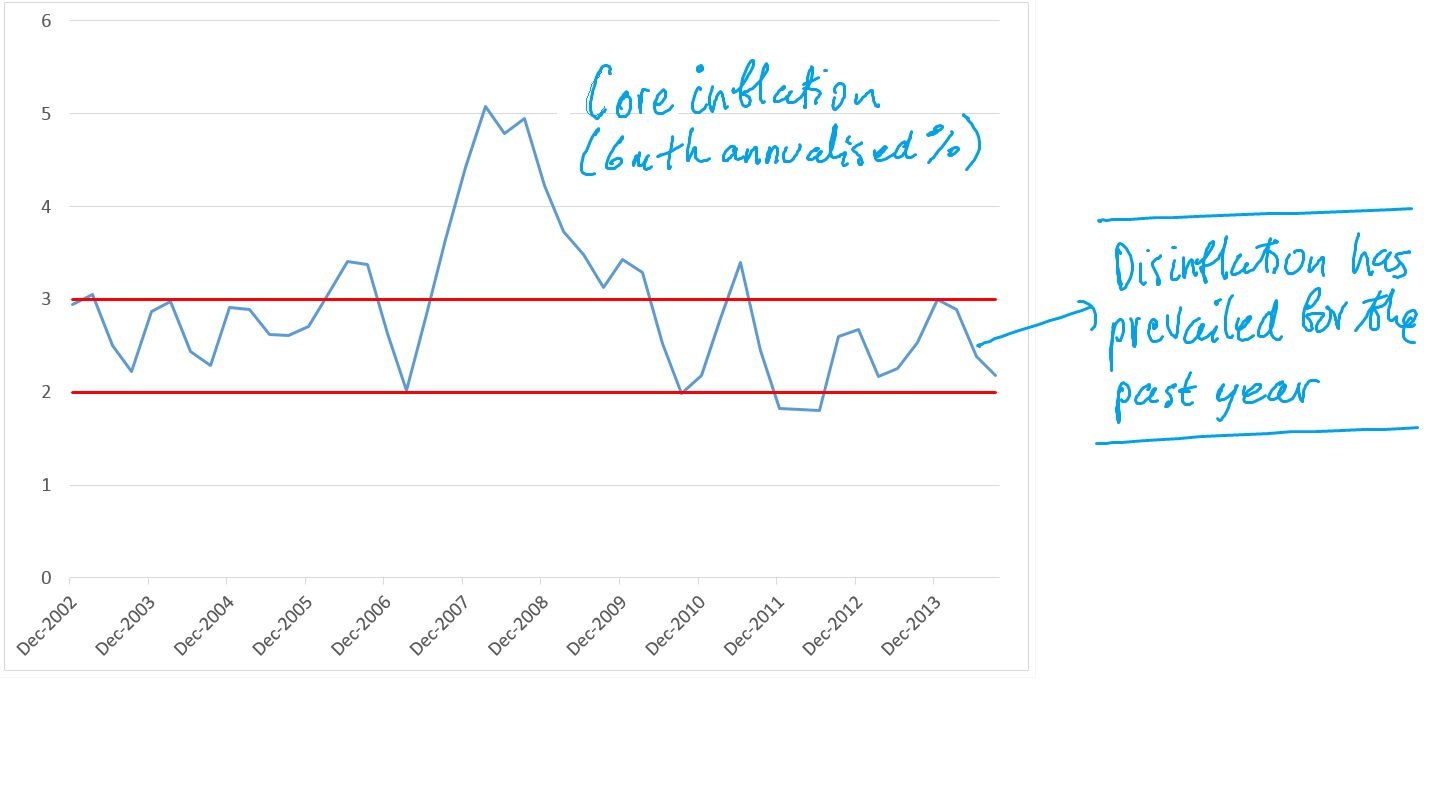
As with most macroeconomic releases, there was something for everyone in today’s December quarter CPI.  For the doves, the precipitous fall in petrol prices has pulled down the headline CPI which is around 1.6% higher than a year ago.  For the hawks, the various measures of core or underlying inflation came in stronger than expected, growing by 0.66% in the quarter.  Nonetheless, on a year on year basis, they remain close to the bottom end of the Reserve Bank’s inflation target range of 2-3%.

For the hawks, the inflation data might not offer a compelling reason for the central bank to cut interest rates.  Unlike many other advanced economies, core inflation has not undershot the bank’s inflation target and the fall in the $A/$US cross rate will lead to inflationary pressures in tradeables in coming quarters.  The hawks would also point to concerns that the RBA Governor has expressed about further stimulus stoking speculative activity in housing.

For doves, such as Evidente, the inflation data does not pose an obstacle to further policy easing for an economy that has been stuck in a nominal recession since 2011.  Animal spirits remain dormant and labour market conditions continue to deteriorate.  Record low growth in private sector wages and households’ heightened concerns surrounding job security – which have lifted by 50% in the past three years - point to considerable slack in the labour market (see chart).

Valuations of the yield trade are not exactly stretched

The yield trade has delivered stellar returns for quite some time now.  A portfolio of high yielding stocks with strong earnings predictability or stability has produced a compound annual return of 23% in the past three years, well above the ASX200 return of 15%.  Investors who have been on the right side of the trade are understandably anxious about the prospect that it unwinds against the backdrop of a cyclical re-bound.

But my quantitative analysis suggests that valuations of the yield trade are far from stretched.  The basket is trading on a PE of 15 based on 12 month forecast earnings, which represents a 3% premium to the ASX200.  But at times over the past three years, the basket has traded at significantly higher premiums (see chart).

Record low bond yields are not a harbinger for a cyclical re-bound

Investors concerned about the prospect of a strong cyclical re-bound would be well advised to interpret what the bond market is telling us.  10 year government bond yields have fallen recently to close to a record low of 3%.  This is the lowest level since mid-2012, a period which coincided with the RBA embarking on a series of rate cuts (see chart).  Clearly, bond investors are not pinning their hopes of a strong cyclical rebound anytime soon, nor are they expecting a resurgence in inflation.

The clock ticks on the global yield trade

Given the ECB’s announcement last week to expand and extend its program of large scale asset purchases, the world’s three major central banks are now aligned in their determination to address the shortfall in aggregate demand, reduce the slack in their labour markets, and boost expectations of inflation and nominal GDP.  The clock is therefore ticking on the global yield trade.  But it will be a while before the synchronised actions from the world’s major central banks successfully revive the dormant animal spirits in the corporate and household sectors.

Key action point: For Australia, the tame CPI print, record low bond yields and the fact that valuations of high yielding stocks with strong earnings stability are not stretched, suggest that the yield trade has yet to run its course.

Further rate cuts from the RBA no saviour for domestic cyclicals

Although still in its infancy, 2015 has so far been a frenetic one for central banks around the world, in what has been a series of synchronised (but not co-ordinated) monetary easings.  Central banks in Switzerland, Denmark, Turkey, Canada and Peru have cut their official interest rates in recent weeks, and at the time of writing, the ECB is expected to extend and expand its program of quantitative easing at its meeting on January 22nd.

The Bank of Canada’s (BOC) decision on Wednesday to cut its key lending rate by 25 basis points to 0.75% has lifted investors’ expectations of a rate cut at the RBA’s February board meeting.  Interbank cash rate futures now point to a 30% probability that the RBA cuts rates by 25 bps in February, up from 20% a day earlier.

In this post, I discuss the implications of the BOC’s decision for the RBA’s policy deliberations, suggest that the RBA should reduce the cash rate to 2% by June and undertake quantitative analysis of previous easing cycles which suggests that domestic cyclicals are unlikely to benefit from rate cuts.

How shocking is the terms of trade shock?

The BOC cited the precipitous drop in the price of crude oil as the key reason behind its decision to ease policy for the first time since 2009.  As a major oil exporter – crude oil accounts for 15% of the country’s export basket – the BOC said that the negative terms of trade shock will have an adverse impact on growth in incomes, wealth, and domestic demand, and reduce inflation pressures.

The BOC highlights the multiplier effects of the lower oil price on investment in oil extraction, which accounts for 3% of GDP.  More generally, the oil and gas sector makes up almost one third of Canada’s business investment.  Against this backdrop, the central bank justified the rate cut as providing insurance against these risks materialising.

Both Canada and Australia are small open economies that are commodity exporters.  But the impact of the oil price decline on the two economies is markedly different because while Canada is a net oil exporter, Australia is a net importer of oil.  So what amounts to a negative terms of trade shock for net oil producers like Canada, is a positive shock for net consumers like Australia (albeit a smaller one).

Although crude oil accounts for 4% of Australia’s export basket, oil imports exceeded exports by $25 billion in 2014, which translates into oil trade deficit of 1.5% of GDP (see chart).  A 50% drop in the price of crude oil therefore equates to a positive terms of trade shock of 0.75% of nominal GDP.

For the RBA then, the lower oil price imparts a stimulus to  nominal GDP.  But like Canada, the lower oil price has arrived at a time when core inflation pressures have been trending lower and inflation expectations remain well anchored (see chart).

Oil, inflation and the RBA’s positive narrative

The lower oil price is not the reason why the RBA should ease policy, particularly as a lift in expected global oil production has underpinned the drop in price.  The key reasons have been present for some time.  Australia has suffered a significant negative terms of trade shock since global iron ore and coal prices peaked in 2011. 

During this time, the terms of trade has declined by around 30%, which has underpinned the fact that Australia has remained stuck in a nominal recession for three years.  In all fairness to the RBA, it cannot control commodity prices, but it could have taken a leaf out of the BOC’s playbook and cut interest rates more aggressively as insurance against growing unemployment.

The sharp decline in the oil price however, provides the RBA with a positive narrative to cut interest rates while downplaying the anaemic state of the nominal economy.  In a blog post on December 12th (Money’s too tight to mention) following an interview from the RBA Governor to the Fairfax press, I suggested that Mr Stevens had started to lay the groundwork for more policy stimulus, based on the prospect that a lower oil price would further reduce inflation pressures to below the RBA’s target range of 2-3%.

I argued that the inflation outlook therefore would form an integral part of the RBA’s positive narrative, so the most likely timing of the next rate cut would be February, a week following the release of what is likely to be a benign CPI print for the December quarter.  Expect another rate cut to follow in at the May board meeting, a week following the release of the March quarter CPI in late April.

Rate cuts no saviour for domestic cyclicals

I have undertaken a quantitative analysis of the performance of domestic cyclicals based on the current easing cycle stretching back to late 2011.  Specifically, I track the performance of the media, building materials and discretionary retail sectors around the two last episodes of rate cuts in late 2011 and through most of 2012/13.  Rather than benchmark against the performance of the market, I benchmark domestic cyclicals against domestic defensives (split out into banks and non-bank defensives).

Domestic cyclicals did not outperform in late 2011, at a time when the central bank cut interest rates by a cumulative 50 basis points.  In fact, the domestic defensives outperformed strongly during that time.  The returns of domestic cyclicals in the second period of policy easing in 2012/13 was mixed. Discretionary retail performed strongly, but both media and building materials underperformed the banks and non-bank domestic defensives (charts are available on request).

The chart below shows the performance of domestic cyclicals in recent months, as the market has gradually factored in another rate cut by May 2015.  The performance of interest sensitive sectors has been mixed, with building materials flying, but discretionary retail and media lagging.

The key caveat to the empirical findings is that the analysis is based only on two episodes of rate cuts in the current easing cycle, and thus is vulnerable to the charge of mindless data mining.  But I believe the way the RBA has conducted monetary policy this cycle is markedly different to past cycles.

And therein lies the answer to the puzzle of why interest-sensitive sectors haven’t performed better around RBA rate cuts in the current easing cycle. Perhaps paradoxically, most of the potency of monetary policy lies in the expectations the central bank creates about future monetary policy; and in this cycle the RBA has been far more ambivalent about stimulating growth than it has been in previous cycles.

This has manifested both in terms of the quantum and timing of rate cuts, and in the RBA's language.  The RBA's timidity reflects its concerns around moral hazard, stoking a bubble in property and rapid growth in investor housing lending. Accordingly, rate cuts to date have had little effect in reviving animal spirits in the corporate and household sectors.

To the extent that further rate cuts are associated with the RBA reminding investors of those concerns, this will blunt the announcement effect on interest sensitive sectors, and will do little to revive entrepreneurial risk taking.  Perhaps this time is different; after all, the prospect of rate cuts in Australia is occurring against the backdrop of synchronised monetary easing globally.  But my bet is that this time won’t be different.

Key action point

If the RBA cuts rates twice in 1H15 (as I expect it will in February and May, immediately after the 4q and 1q CPI prints to promote a positive narrative for policy easing), no need to be overweight domestic cyclicals.

The IMF's Patience with the ECB wears thin

Policy makers – particularly those that transcend national borders – normally ensure that they are singing from the same hymn sheet.  But the updated World Economic Outlook (WEO) reveals that the IMF is (rightly) fed up with the ECB’s timid approach to monetary policy.

The IMF argues that monetary policy in the euro area remains slow to respond to the persistent decline in inflation and as a result, the region is vulnerable to any shock that leads to further disinflation or outright deflation.  The IMF urges the ECB to take heed of market expectations, arguing that financial markets are already broadly anticipating further monetary policy (at the forthcoming ECB meeting on 22 January).

The IMF’s frustration with the ECB is understandable because it expects euro area to remain anaemic, growing by a paltry 1.2% and 1.4% in 2015 and 2016, revised down by around 25 basis points from the last WEO update in October 2014.  This on the heels of the euro area expanding by only 0.8% in 2014.

The New Mediocrity and Dormant Animal Spirits

More generally, the IMF appears to have adopted the Larry Summers ‘secular stagnation’ view of the post crisis global economy, which it describes as the ‘new mediocrity.’  This view draws heavily on the Reinhart/Rogoff interpretation of history which shows that recoveries from balance sheet recessions are structural and therefore painfully slow.

The IMF lends support to this view by arguing that the downgrade to the global growth outlook primarily reflects dormant animal spirits;  ‘investment weakness as adjustment to diminished expectations about medium term growth prospects’ and highlights the downside risks to prospective potential output.  In terms of the numbers, the IMF expects the world economy to expand by 3.5% and 3.7% in 2015 and 2016, around 30 basis points lower than in October 2014.

But the IMF’s significant lift to the growth outlook for the US (to 3.6% and 3.3% for 2015 and 2016) should provide a reminder that cyclical factors have played an important role in the slow post-crisis recovery.  Since 2012, the US Federal Reserve has been arguably the most aggressive central bank in its conduct of forward guidance and quantitative easing, an approach which has clearly been informed by the policy errors committed around the Great Depression and recession in 1937.

The divergent growth paths of the United States and euro area in recent years should help to dispel the myth that the monetary policy is ineffective at the zero lower bound.  The counterfactual of tighter monetary policy in the United States would surely have been associated with higher and rising unemployment and slower growth, which the euro area has experienced.

Encouragingly, the IMF endorses the aggressive conduct of monetary policy to reduce the still large output gaps in most economies.  It argues that central banks must remain alert to the possibility that further disinflation does not lead to an additional drop in inflation expectations.  This would surely be a positive for most asset classes thanks to an abundant supply of liquidity.

Please Curb Your Enthusiasm...

The IMF is not alone in downgrading the outlook.  Like many economic forecasters, it has under-estimated the lingering effect of the financial crisis and the timid responses from many central banks.  But the IMF has tended to be too optimistic over the sweep of the past two decades; it has persistently over-estimated world growth over two thirds of the time (a chart is available on request).

Unlike sector analysts who are incentivised to offer excessively optimistic forecasts of company profitability to curry favour with management and garner corporate banking business, it is a puzzle that the IMF’s forecasts have exhibited excessive optimism. 

...but China's Outlook Is Too Pessimistic 

But its forecasts for China look unusually downbeat.  It has downgraded China’s growth to 6.8% and 6.3% in 2015 and 2016, citing the greater willingness of authorities to address the vulnerabilities associated with rapid growth in credit and investment of recent years.  But growth of sub-7% appears to be at odds with the history of growth for a number of Asian economies over the past half century, at a comparable level of China’s development today. 

My yet to be published analysis suggests that growth in GDP per capita of 7.5% is sustainable over the next two decades, underpinned by catch-up as it continues to borrow from already developed technologies and know-how.

Investment Implications - Overweight Safety

As long as the IMF and other economic forecasters continue to downgrade expectations of global growth, investors should be overweight safe assets and defensive sectors within stock markets, particularly companies that offer sustainably high payout yields, and strong earnings predictability. 

Australian stocks that score strongly across screens for payout yield (including capital returned via buybacks) and earnings predictability include: CSL, NVT, AMC, TLS, DLX, WOW, APA, CBA, BXB, SYD and CPU (the full rank of stocks is available on request).


The RBA needs to take 'credit' for debt aversion

The November credit aggregates confirmed that outside of mortgage lending, households and businesses remain reluctant to lift gearing and remain focussed on balance sheet repair.

Business credit expanded by 0.2% in November to be 4.5% higher than a year ago, while personal credit has been stagnant in the past year.  The recovery in personal and business credit since the crisis has been painfully slow.  Business credit has only just reached its pre-crisis peak, while personal credit remains around 10% below its pre-crisis peak (see chart).  That animal spirits in the corporate and household sectors remains dormant suggests that money has been tighter than implied by interest rates being at multi-decade lows.

The only part of the economy where animal spirits are buoyant is housing.  The stock of housing credit is 7% higher than a year ago, driven by owner-occupiers, but mainly investors.  Momentum in investor housing credit remains strong and it is noteworthy that it is 10% higher than a year ago.  Glenn Stevens, the RBA Governor, has previously flagged concerns about this segment growing at double digit rates, given that many of these loans are interest only.

Clearly, concerns that monetary policy ought to lean against the possibility of a bubble in housing continues to occupy the upper echelons of the RBA.  Deputy Governor Phillip Lowe, has previously published work with the Bank of International Settlements, suggesting that central bankers should be wary of large asset price gains when they associated with rapid growth in credit.  Thus the credit aggregates appear to be taking on greater importance in helping the RBA to disentangle fundamentals from speculative elements of asset price inflation.

As long as growth in business credit remains sluggish, bad and doubtful debts are likely to remain low by historical standards, while the anaemic growth in personal lending provides little cheer among discretionary retailers.

Behavioural traps for active managers to avoid (Part II)

In the second instalment of behavioural traps that active managers should avoid, Evidente argues that the costs of over-confidence out-weigh the benefits, recommends that portfolio managers should engage in DIY diversification rather than leaving it to corporates, and cautions PMs to not over-rely on DCF valuations.

In praise of being humble

A number of widely cited studies in the field of applied psychology document the above average driver effect, in which the overwhelming majority of respondents believe that their driving abilities are above average.  Over-confidence or illusory superiority is not confined to self-perceptions of driving ability.  Many people over-estimate their abilities, knowledge and future prospects compared to others.

Terrance Odean and Brad Barber have explored the effects of over-confidence in a financial market setting.  They assert that over-confident investors over-estimate the precision and accuracy of their information, which lifts the likelihood that such investors trade too frequently based on their perceived superior information.  The empirical evidence is not kind to over-confident investors; excessive trading is associated with inferior performance.

Odean and Barber also use over-confidence to link gender with trading performance.  Female portfolio managers have superior track records than their male counterparts thanks to lower churning of their portfolios because they are less prone to suffering from over-confidence.

The key lessons are obvious; PMs ought to be more humble and trade less.  Even when investors believe that they have access to superior information, they should be cognisant of the limits and costs to arbitrage, which can cause mispricing to persist for an extended time.

Ironically, the evolution in the structure of the funds management industry might actually reward over-confidence.  Fund of funds and asset consultants are increasingly shifting towards a core –satellite approach to portfolio construction, where index and smart beta products are combined with high conviction/high tracking error funds.  These funds typically require PMs to have a high degree of confidence in their stock calls, and be willing and able to take large active bets.

Overconfidence probably also contributes to the profitability of the betting against beta trade, which represents the poor returns from high beta stocks.  Overconfident PMs – particularly those working in high conviction funds whose clients expect high returns - are more likely to buy high beta or cyclical stocks to generate outperformance.  The strong appetite for such stocks lifts their price and drives down their expected future returns. 

The world’s most successful investor appears to have intuitively long understood the benefits of betting against beta.  In an academic article published recently (Buffett’s Alpha), researchers attribute Warren Buffet’s superior track record to his willingness and ability to use leverage to lift his exposure to low beta securities.

Don’t outsource diversification to corporates

In recent times, BHP announced a plan to spin-off its non-core assets into a new entity, South32, while Orica has sold its chemicals business to Blackstone after undertaking a strategic review of operations.  These announcements come not long after Amcor and Brambles undertook major restructuring, spinning off Orora and Recall respectively, while Tabcorp and Fosters have also completed demergers in recent years.

The trend towards greater corporate focus has had a long gestation period and is a welcome development.  Long gone are the days where it was common practice for firms to undertake mergers and acquisitions in unrelated industries to boost flagging growth prospects.  Growth prospects for many diversified enterprises have simply not met expectations with the failure stemming from a lack of management focus and the inability of internal capital markets to allocate resources efficiently across often disparate and unrelated business units.

Yet some investors continue to have a strong preference for conglomerates on the basis that diversified firms offer defensive attributes and are not forced to rely on at times fickle capital markets to raise funds.

The tendency to believe that that conglomerates represent ‘safe’ diversified firms stems from the availability and representative heuristics.  Some investors have a high familiarity with the strong track records of better known conglomerates with high profile CEOs, including GE and Wesfarmers, which have shaped investor perceptions about the benefits of corporate diversification (despite the fact that GE has performed dismally since the financial crisis).  From this small but highly influential sample, some PMs extrapolate and assign these attributes to other diversified firms.

The trend towards corporate focus and strong performance from focussed and less complex firms confirms that financial diversification has won over corporate diversification.  PMs who wish to participate in diversification benefits should do it themselves rather than out-sourcing to corporates.

Over-estimate the precision of DCF valuations at your peril

Price targets and DCF valuations have taken on a tremendous amount of importance amongst sell-side analysts over time.  Changes to recommendations are often supported by the price of a stocks being significantly higher or lower than the analyst’s target price, which is typically based on a DCF valuation.

Modelling a DCF valuation can offer a sell-side analyst a competitive advantage.  A detailed and granular model provides scope for sensitivity and scenario analyses, which some PMs have a strong appetite for.

But the long duration of stocks means that DCF valuations are awfully sensitive to inputs used, including the perpetuity growth rate and discount rate.  To illustrate, I use the Gordon Growth dividend discount model (DDM) which says that the price of a stock is equal to its prospective dividend discounted at the rate of the discount rate minus the perpetuity growth rate in dividends.

The standard approach is to use the Capital Asset Pricing Model to calculate the discount rate, which equals the sum of the risk free rate and the product of a stock’s beta and the expected equity risk premium.

The chart below depicts the non-linear relationship of the DDM valuation (vertical axis) to variations in the discount rate (horizontal axis).  The orange line corresponds to a high growth stock, and the blue line corresponds to a low growth stock.  Both stocks are assumed to pay a dividend of $5 in the next period. 

For the low growth stock, a small increase in the discount rate from 6% to 8% is associated with the DDM valuation halving from $250 per share to $125!  The relationship becomes flatter or less sensitive at higher discount rates.  But even a lift in the discount rate from 14% to 16% reduces the DDM valuation by close to 20%.

The steepness of the curve for the high growth stock confirms that the DDM valuation is even more sensitive to changes in the discount rate.  A rise of only 50 basis points in the discount rate to 9% is enough to reduce the valuation by half to $512.  To put the discount rate effect in perspective, subject to the assumptions used for the risk free rate and risk premium, a tiny rise in the stock’s beta from 0.8 to 0.9 is enough to generate a 50 basis point lift in the discount rate to 9%.

Insights from behavioural finance can help shed light on why sell-side analysts continue to rely heavily on DCFs in their decision making process, despite the sensitivity of inputs used.  First, the DCF valuation framework is considered by many to be more intellectually rigorous than other valuation techniques, including price to book and price to earnings ratios.  Second, the availability heuristic causes people to turn their attention to what is directly observable.  It so happens that the output of the DDM is easy to interpret and directly observable, while the inputs are not.  Third, the view that a stock has an intrinsic value helps to anchor our expectations and filter out what we consider to be irrelevant information.  Fourth, when billions of dollars are at stake, stakeholders assign a greater level of precision to DCF valuations than is warranted thanks to the institutional setting.

In short, PMs should be wary of sell-side analysts who bang the table with a high conviction buy or sell call based on their DCF valuation.  Over-estimate the precision of DCF valuations at your peril, particularly for high growth stocks.

Part III 

In the third instalment of this series, Evidente highlights the importance of seeking out independent and alternative sources of information to generate sustainable alpha, argues that price gaps do not necessarily amount to burst bubbles, and warns of the tendency and costs of riding losers for too long and selling winners too early.


Behavioural Traps for Active Managers to Avoid (Part I)

Behavioural finance is the intersection of applied psychology and the behaviour of financial market participants.  The likes of Richard Thaler, Nicholas Barberis, James Montier, Nobel prize winners, Robert Shiller and Daniel Kahneman, and many others have done a tremendous job in elucidating the heuristics or mental rules of thumb that investors (and broking analysts) rely on, which contribute to systematic errors in judgement and decision-making.

Some of these heuristics include: representativeness (leads to extrapolation), availability (leads people to over-estimate the probability of familiar and salient events), anchoring or framing (can distort decision making by affecting a person's frame of reference) and self attribution or over-confidence (people attribute their good performance to skill and judgement, and poor performance to bad luck or factors beyond their control).

Although these errors are not unique to financial market participants, it is reasonable to think that such errors can be costly, particularly when portfolio managers are managing billions of dollars.  If enough investors suffer from such biases they also lead to significant limits to arbitrage, which imposes costs and risks on investors who are less ‘irrational.’

2014 has proven to be another difficult year for active fund managers in Australia and worldwide for cyclical and structural reasons.  The unexpected decline in sovereign bond yields confirms that investors eschewed risk from their portfolios.  Further, the structural shift towards low cost beta like products that commenced since the financial crisis continued, as investors remain sceptical of the ability for active funds to consistently deliver alpha after costs and fees.

At a time when the philosophy of active management is coming under attack as active funds continue to lose market share to ‘dumb’ and ‘smart’ beta products, it behoves PMs to be cognisant of, and avoid behavioural traps.

Hindsight bias

Hindsight bias is better known colloquially to many people (at least in the United States) as the ‘Monday quarterback’ phenomenon.  In the best seller, Expert Political Judgement, Phillip Tetlock argues that hindsight bias amounts to discounting counterfactual scenarios that might have realistically emerged when considered in real time.  He provides compelling evidence that political scientists are prone to look back and believe incorrectly that they had predicted certain outcomes that came to pass.

It is far too easy for fund managers to also fall into this trap because they forget what their views might have been in real time.  After all, financial markets are noisy at the best of times, particularly as the signal to noise ratio is typically low.

There is good reason why financial market participants suffer from hindsight bias.  In an industry where the ability to articulate a convincing story is just as important as track record to growing assets, over-confidence can be a valuable commodity.  But hindsight bias and over-confidence are detrimental to delivering alpha because they limit the ability for broking analysts and investors to learn from past mistakes.

The obvious way for PMs to avoid this behavioural trap is to diligently document their views in real time, which provides scope to look back and benchmark those views with events that subsequently transpired. 

The process can also help to disentangle the role of luck from skill.  For instance, an overweight position in Qantas in early 2014 might have been justified on the prospect of a CEO succession event in the near term.  No such event transpired, but the overweight position has been profitable, based primarily on the precipitous fall in crude oil prices that few had predicted at the start of the year.

The stock market is not a discount store

Profit warnings are a godsend to brokers.  They provide much need volatility and generate trading opportunities largely because they garner the attention of PMs, some of whom like to engage in bargain hunting.  The problem is that the stock market is not a discount store.  The discount store mentality arises due to framing, which distorts the investor’s perspective because they have been conditioned or become accustomed to a higher stock price.  So a profit warning and a sharp fall in price triggers a view that a stock is cheap and thus offers a bargain.

In late 2013, QBE issued a profit warning, citing problems in their North and South American operations, lower than expected investment earnings stemming from the US Federal Reserve’s zero interest rate policy and the persistently high $A.  The stock subsequently fell by over 30%, representing an 8 standard deviation event.  Analysts downgraded their earnings forecasts by around 20%. 

On face value, this amounted to a market over-reaction.  But it is reasonable to think that investors were assigning a higher beta and discount rate to the company’s future growth prospects, thus accounting for the stock’s sharp price decline.  After all, this was another in a long line of profit warnings, the business is a complex and globally diversified insurance company with poor visibility in its far flung operations, and management continue to deal with the legacy of two decades of acquisition led growth.

A number of broking analysts at the time upgraded their recommendation to buy, thanks to the view that the profit warning represented a clearing of the decks of sorts, particularly as it was accompanied by the resignation of the company’s chairperson.  Some of those analysts – influenced by the sharp rise in global bond yields in May 2013 associated with the ‘taper tantrum’ – also believed that interest rates would continue to increase over the course of 2014 associated with a normalisation of US monetary policy, which would be a tailwind for the company's investment earnings.

As it happened, yields subsequently fell sharply in 2014, most of the world’s central banks maintained zero interest rate policy settings, and despite the stock bouncing in the month after the profit warning, twelve months down the track, QBE has performed broadly in line with the market (see chart).

Who’s afraid of stocks trading at a 52 week high?

Price momentum is one of the most widely studied and robust pricing anomalies documented in equities and other asset classes, across time and countries.  Stocks that perform well over six to twelve months tend to continue to yield strong returns for up to six months.

Journal research from the United States provides an interesting twist on the momentum anomaly; stocks trading at or close their 52 week high continue to yield strong returns in the short-term. 

The authors offered a behavioural explanation; many investors are put off by buying such stocks due to concerns that the horse has bolted; a corollary of the discount store framing.  An institutional explanation might also be at play.  Portfolio managers may believe that they have reputational risk to manage if they buy a stock at its peak and it subsequently under-performs, based on concerns at being seen to be swayed by investor sentiment.

My back-testing work for Australia over the past decade shows that stocks trading at or near their 52 week high have continued to outperform in the short term, and 2014 was no exception.  An equal weighted portfolio spread across the 15 large cap stocks trading at a 52 week high at the end of 2013 has yielded a total return of 6.7% year to date, well above the 4.5% from the ASX100 index.  A number of stocks underpinned the outperformance: RHC, SEK, TAH, TLS and AMC, while the key drags were NVT and TPI.

Given that investors eschewed risk in their portfolios over the course of 2014, it is little surprise that the current basket of stocks trading at or near their 52 week high has a strong defensive theme: CTX, GPT, RMD, TLS, TCL, SYD, ANN, COH, NVN, SKI, IPL, APA, ORA, CBA and RHC.

Do not be seduced by a company’s growth prospects and the art of storytelling

A cornerstone of behavioural economics and finance is that we rely on heuristics or rules of thumbs to help us deal with information overload, since humans can absorb and process only so much information.  Financial markets are an apt setting to investigate these heuristics because portfolio managers are confronted with tremendous amounts of information, much of which is noise.

Story telling iss an effective way to help people to make sense of their world, as well as process and communicate information.  People can relate to stories, they can benchmark the stories of others with stories of their own, and stories garner people's attention.  Many CEOs understand this and are able to articulate a compelling story to buy their stock based on the prospect of strong growth.

Buying a basket of stocks with high expected growth in profitability at the end of 2013 has yielded an equal weighted return of over 10% year to date, well above the index return.  But this represents the exception; these stocks have typically delivered dismal returns over the sweep of the past decade (chart is available on request).  The third quartile or mid-growth stocks represents the sweet spot.

The poor returns from high growth stocks is not unique to Australia; the high growth anomaly is robust across the United States and other countries.  The poor performance reflects a number of factors.  Seduced by the prospect of strong growth and possibly some compelling storytelling, investors are lulled into over-paying for future growth.  Second, broking analysts and PMs tend to extrapolate past growth too far into the future.  Third, investors under-estimate the level of risk and uncertainty associated with high forecast growth.

Conversely, the mid-growth stocks are perceived by many to be dull, offering the prospect of little capital growth, and pay out high dividends due to limited growth opportunities.  Because they do not provide as a compelling story as the blue sky embedded in high growth stocks, PMs are prone to under-pay for these attributes.

At present, stocks with high forecast growth (stocks to avoid) are: ILU, OSH, ALL, CSR and BSL, while mid-growth stocks (stocks to buy) include: ANN, TLS, PRY, SGM and TAH.

The illusion of control and the (limited) influence of CEOs

Individuals - particularly those that are over-confident - typically over-estimate the control they have over events, and discount the role of chance or factors beyond their control.  Since many financial market participants are over-confident, PMs need to be careful that they do not over-estimate the importance of management quality on company performance.

Many PMs like to showcase their ability to identify and only invest in companies with good quality management.  CEOs are the custodians of shareholders’ funds, so skilled managers whose interests are aligned with shareholders ought to be necessary conditions for a company to deliver sustainably strong returns.

But factors beyond the control of the CEO and management affect the profitability and performance of a stock, including the state of the domestic and global economy, outlook for interest rates, the supply and demand for credit, shifts in technology and consumer tastes, unexpected changes in the regulatory environment, health of the banking system, and investor sentiment, just to mention a few.

Sydney Airport (SYD) demonstrates that good quality management can have little bearing on a stock’s performance.  SYD is a monopoly asset that generates highly predictable cash flows, with limited exposure to the economy primarily through passenger numbers. 

Shifts in the $A are broadly neutral for passenger numbers; a fall in the currency this year encouraged a lift in overseas arrivals but reduces the number of Australians travelling abroad.  Passenger numbers in the past have been adversely affected by factors beyond the control of management, including the spread of the SARS virus and the s11 attacks.

More recently, the strong outperformance of the stock reflects factors that have little to do with management: the strong appetite for safe assets, subdued top line growth for most companies thanks to the economy remaining stuck in a nominal recession, the decline in sovereign bond yields and continued strong performance of the yield trade.

PMs should not entirely discount the role of management and the incentives they face as a guide to the alignment (or non-alignment) of interests with those of shareholders.  But they should not discount the role that systematic factors outside of a CEO's control play, in driving stock performance.

Part II

In the second instalment, Evidente will discuss other behavioural traps for active managers to avoid, including: over-estimating the precision of DCF valuations, dangers associated with neglecting the regulatory and fiscal landscapes, the problems of chasing down answers to questions that don't matter, and the importance of seeking out alternative and objective sources of information.

Reinhart and Rogoff Continue to Cast a Shadow

A number of years ago, Carmen Reinhart and Kenneth Rogoff wrote the best seller, This Time Is Different: Eight Centuries of Financial Folly, which showed that highly indebted governments were associated with prolonged slow economic growth.  The book’s main theme resonated around the world due to the then unfolding European sovereign debt crisis in 2011.  Since then, governments worldwide have been reluctant to use fiscal policy to stimulate their economies which has put the onus on monetary policy to help overcome the global shortfall of aggregate demand.

The Government’s Mid-Year Economic and Fiscal Outlook (MYEFO) is a timely reminder that Australia, like most other advanced economies, is suffering from deficient demand and as a result, remains stuck in a nominal recession.  The Commonwealth Treasury has slashed its forecast for nominal GDP growth in 2014/15 to 1.5% (from the Budget estimate of 3%), and marginally downgraded the growth forecast for 2015/16 to 4.5% (from 4.75%).

If the estimate for 2014/15 comes to pass, it would be the fourth consecutive year of sub-4% growth, effectively dragging the economy into another year of a nominal recession, the longest such stretch since the economy shifted to a low inflation regime from the early 1990s (see chart).

The Treasury has consistently over-estimated the outlook for nominal GDP for over three years now, and obviously been surprised by the extent of the slide in prices for Australia’s key commodity exports (see chart).  The terms of trade – the ratio of export to import prices, which represents a measure of a country’s purchasing power – has declined by one quarter from its 2011 peak, which in a mechanical sense, has slowed growth of nominal GDP.

The Reserve Bank has clearly been frustrated by the persistently strong currency.  In the face of the 25% decline in the terms of trade, the Trade Weighted Index has fallen by only 15%.  So the currency hasn’t performed its shock absorbing role in response to the negative terms of trade shock as well as in the past.

A number of factors have underpinned the currency’s resilience: the safe haven status that the $A offers at a time when global investors have had an insatiable appetite for safe assets, and Australia’s still large interest rate differential; Australia continues to have among the highest policy rates across the developed world at a time when world’s major central banks have maintained a zero interest rate policy.

The Reserve Bank has little power over the prices of the country’s commodity exports, but should have used monetary policy more proactively to boost growth in nominal GDP, by reviving animal spirits in the corporate, household and even the public sectors.

The economy’s nominal recession has suppressed growth in the key nominal variables, notably tax receipts, company revenues and employee compensation.  Per capita tax receipts collected at the Commonwealth level has grown at an annualised rate of 4.3% since 2010, well below the 6% compound annual growth over the preceding two decades.  Given that the cyclical environment is unlikely to be supportive, the Treasury’s forecast of a lift in compound annual growth of tax receipts to 5% over the next four years looks a touch too optimistic (see chart).

The two charts below confirm the extent of slowing in per capita company revenues and employee compensation in recent years.  No wonder then that consumer and business confidence have remained fragile for an extended period.

If the economy is going to pull out of its long nominal recession, the Reserve Bank should no longer under-estimate the power of monetary policy to revive animal spirits in the corporate, household and public sectors.  Because its timid approach to ameliorating the effects of the negative terms of trade shock  – stemming from concerns over house prices and rapid growth in lending for investor-housing – has imposed a significant cost to the broader community in terms of lower growth in tax receipts, company revenues and employee compensation

The Reinhart/Rogoff thesis still casts a shadow over the pro-active use of fiscal policy and the ability for governments to lift debt to finance capital spending.  This has encouraged governments in Australia to undertake privatisations to raise funds and retain their credit ratings.

The Federal government faces a delicate task between not further undermining already fragile consumer and business confidence in the short-term, but putting their financial positions on a sustainable footing over the longer run.  Further rate cuts accompanied by more aggressive rhetoric from the Reserve Bank would offer the government more wiggle room by lifting growth in nominal GDP and tax revenues.

Looking through the prospect of any cyclical recovery in tax receipts, a lift in the corporate tax burden is probably inevitable to assist in the government's medium term strategy of fiscal consolidation, particularly at a time when the growing political influence of retirees will limit the ability to reform healthcare entitlement spending.  

Portfolio managers should therefore be cautious about stocks and sectors that are exposed to greater tax regulatory risk.  To that end, Evidente will examine those stocks with low effective tax rates in a forthcoming blog post.


Money's too tight to mention

In May this year, Evidente wrote an article published in the Fairfax press which drew parallels between the Reserve Bank’s much anticipated recovery in capital spending by the non-mining sectors and Samuel Beckett's play Waiting for Godot, in which the two protagonists wait for Godot under a willow tree, where he said he would meet them.

By the end of the final act, Estragon and Vladimir's optimism and anticipation remain palpable, yet Godot's arrival is no more imminent than it was at the beginning of the play.  Rarely has such patience been so unrewarding.

Seven months down the track and regrettably, the RBA still finds itself in the same predicament.  That much is evident from the growing chorus of economists calling for easier policy, the increased frequency of the term ‘income recession’ to describe the state of the economy, the slide in prices for Australia’s key export commodities, iron ore and coal, and the fact that animal spirits remain dormant in the business and household sectors.

Mr Stevens highlights the fact that since the RBA started to ease three years ago, it has brought the cash rate down to its lowest level in his lifetime on a sustained basis, and he believes that borrowing costs do not represent an obstacle to the recovery.  He re-iterated that it is now up to the corporate sector itself to regain the psychology of risk taking and invest in projects for future growth.

There a number of issues worth exploring in more detail here.  First, economist and author of the Money Illusion blog, Scott Sumner, draws attention to the work of Milton Friedman who argued that low interest rates – whether measured in nominal or real terms – do not mean that policy is easy.  Rather, low interest rates are an indication that money is tight.  In other words, focus on the reason why interest rates are so low.  In the case of Australia, it is because the economy has been stuck in a nominal recession for three years now (see chart below which depicts annualised growth in nominal GDP).

Second, Mr Stevens continues to under-estimate the power of monetary policy to revive the corporate sector’s animal spirits.  From a capital budgeting perspective, the effects of the compounding effect of a lower risk free rate can be powerful.  But arguably, the monetary policy transmission mechanism is more powerful via the impact on the other part of the discount rate, the expected equity risk premium (ERP).  It is reasonable to think that the amplitude in the ERP is far larger and more important driver of changes to discount rate than shifts in the risk free rate.  And monetary policy can also help to boost expectations of revenue growth and cash flows.

Indeed, the capital budgeting framework sheds light on why money remains tight.  Greater uncertainty - reflected in a persistently high ERP - and expectations that revenue conditions remain subdued, are contributing to the corporate sector's reluctance to invest (and hire).  The deterioration in labour market conditions is evident from the rising unemployment rate and the fact that unemployment expectations are 50% higher than three years ago, around the start of Australia’s nominal recession (see chart).

A positive narrative for a February rate cut

Mr Stevens has devoted most of the this year to developing the central bank’s own forward guidance that an extended period of interest rate stability represents the optimal policy setting.  He has cited concerns around stoking a bubble in house prices and rapid growth in lending for investor housing as reasons for being prudent.

The central bank is clearly mindful that cutting further would exacerbate these concerns and also signal that the outlook had deteriorated materially, particularly at a time when consumer and business sentiment remains fragile.  Thus Mr Stevens has started to lay the groundwork for what he describes as a positive narrative for abandoning the bank’s own forward guidance.

This foundation focusses on the prospect inflation pressures remain well contained and that inflation does not present a barrier to a lower cash rate.  Low wages growth is suppressing unit labour costs – productivity adjusted wages – and the sharp pull back in the oil price will help to ameliorate the inflationary impact of dollar depreciation.

Mr Stevens is surprisingly upbeat about the prospects for global growth of the sharp fall in crude oil prices.  While it is difficult to disentangle the supply and demand dynamics in real time, it is reasonable to think that lower global growth expectations have contributed to lower prices (along with a lift in expected production stemming from the North American supply boom).  Although oil importing nations stand to benefit at the expense of oil exporters, it is difficult to assess the net effect on global growth of these shifts in expected demand and supply.

Given that the inflation outlook will form an integral part of the RBA’s positive narrative, the most likely timing of the next rate cut is February, a week following the release of what is likely to be a benign CPI print for the December quarter.

A change in mindset for portfolio construction

Economists and portfolio managers are no doubt re-assessing their portfolio construction in light of the prospect that the RBA might deliver more rate cuts in the new-year.  But I believe that a better starting point is to acknowledge that money is, and has been, too tight for at least three years now and that this has contributed to Australia’s nominal recession.

This starting point can help to explain a number of patterns in the stock market and corporate landscape market in recent years: slow growth in nominal GDP, persistently weak revenue conditions, corporate restructuring, a trend towards greater corporate focus (thanks to the demerger wave), rising unemployment, investors’ growing appetite for dividends, and the strong and sustained performance of the yield trade.

Even with the prospect of another rate cut (or two) in 2015, my expectation is that the RBA will be the reluctant rate cutter, which will undermine the potency of policy to revive animal spirits.  Against this backdrop, Australia will likely remain stuck in a nominal rut and the stock market trends that have prevailed for the past three years are likely to persist.  Mr Stevens is discovering that being too patient comes at a very high price.

Australia's nominal recession: No end in sight

The media and economists have started to describe the Australian economy as having entered an income recession.  The fact is that Australia has been stuck in a nominal recession for three years now.  During that time, nominal GDP (which in effect is the sum of real GDP, domestic inflation and the terms of trade) has grown at a paltry annualised rate of 2.6%.  This represents a weaker outcome over a three year period than even the balance sheet recession of the early 1990s (see chart).

Economists might wish to argue about the benefits of focusing on real GDP, particularly across periods characterised by different rates of inflation.  But low inflation in Australia has persisted for over two decades now, and nominal GDP represents a better gauge for household and business sentiment.  After all, employees earn nominal wages and businesses do not generate inflation adjusted cash flows.  Given that portfolio managers continue to project company cash flows in nominal terms, it remains puzzling that economists remain fixated on real GDP.

Australia's nominal recession is more than just of passing academic interest, because low growth in nominal GDP has underpinned persistently subdued revenue conditions.  Since mid-2011, analysts have downgraded their revenue forecasts for the ASX200, which remains 15% below the pre-GFC peak (see chart).

Given that top-line growth has been so weak, it is little surprise that companies continue to trim costs aggressively, defer capex, undertake restructuring and are becoming more focussed (thanks to the de-merger wave) in order to boost profitability and cater to investors' insatiable appetite for income.  Consequently, the Australian economy has undergone a productivity renaissance over the past three years.  Despite the slowdown in productivity growth in the September quarter, it has grown at an annualised rate of over 3% since March 2011, growth not seen since the golden period of the late 1990s and early 2000s (see chart).

HoursWorkedStagnated.jpg

The flipside from the widespread corporate restructuring and greater corporate focus is that labour market conditions continue to deteriorate.  Aggregate hours worked has now been stagnant for over three years, which is a dismal outcome considering that Australia's population growth has boomed over this time (see chart).

Glenn Stevens, the RBA Governor, has drawn the line in the sand and made it clear that he doesn't see that monetary policy has a role to play in reviving the corporate sector's animal spirits.  The RBA clearly has little influence over the steep decline in commodity prices and the terms of trade.  But at a time when the economy is suffering from a shortfall in aggregate demand, the RBA's timid approach to monetary policy continues to consign Australia to a nominal recession.

Stock picking necessary to add alpha in domestic cyclicals while investors will continue to reward sustainable dividends

Against this backdrop, domestically exposed cyclical sectors - particularly discretionary retail, consumer services and media - will continue to be beset by revenue headwinds.  Investors would be wise to cherry pick those companies in these sectors that would benefit from industry consolidation or those that have low operational leverage (ie. the ability to lift efficiency without undermining their sustainable sources of competitive advantage).  As long as the nominal recession persists, investors will continue to reward companies that have the ability to become more focused, shed underperforming assets and sustainably lift payout ratios.  Despite commodity price headwinds, the big miners are becoming increasingly well placed to return capital to shareholders.


Low interest rates are here to stay, but don't expect stocks to re-rate

In a speech delivered last night, Philip Lowe, Deputy Governor of the Reserve Bank, offered a timely reminder that global imbalances continue to depress rates of return available to savers.  Despite the narrowing of current account balances in the past decade, business investment intentions continue to fall short of desired saving.  Faced with the prospect of getting low returns from their deposit accounts, savers continue to look for better returns elsewhere and in the process, have lifted the demand for, and prices of other assets.

Indeed, the persistence of low long term interest rates around the world continues to confound the forecasts of many economists and analysts.  Sovereign bond markets around the world have rallied this year with the yield on US 10 year treasuries declining to below 2.5%.

The bond conundrum and the global saving glut a decade on

Low long term interest rates have had a long gestation period.  Almost a decade ago, Alan Greenspan, the then chairman of the US Federal Reserve, remained puzzled by persistently low US treasury yields at a time when the central bank was lifting official interest rates.

A month later in March 2005, Ben Bernanke attributed unusually low long-term real interest rates to a glut of global saving; an excess of desired saving over business investment intentions.  Alternatively, others described this phenomenon as a manifestation of global imbalances; countries like the USA were running a large current account deficit while Asia and the oil exporters were running large current account surpluses.  An abundance of financial capital meant that there was too much saving chasing too few business investment opportunities.  The price of money or long term interest rates subsequently declined.

The global saving glut had its antecedents in a number of financial crises in 1990s spanning Latin America and Asia, which encouraged governments in emerging economies to save more for a rainy day.  The boom in oil prices also boosted the coffers of oil exporters.  Emerging markets therefore swung from being modest net borrowers of capital in 1996 to being significant net lenders from the early 2000s.

While global saving grew rapidly, there was not a commensurate rise in business investment intentions, which exacerbated the imbalance between saving and investment.  Following the end of the dotcom boom in 2000, the sharp decline in stock prices dampened the appetite of firms to commit to new projects.  The resulting excess liquidity found its way into various assets, notably US treasuries, stocks and mortgage backed securities.

Where have all the safe assets gone?

The global financial crisis lifted the appetite for safe assets precisely at the same time as reducing the available supply of credible safe assets.  The precipitous fall in US home values and collapse of the sub-prime mortgage market made investors wary that US housing was no longer a one way bet.  The market for US treasuries in particular benefited from its safe haven status and liquidity, which continued to attract strong demand from foreign central banks and governments.

Ricardo Cabarello from MIT draws an analogy between safe assets and parking slots to explain why long term interest rates have remained low.  A rise in the number of cars and reduction in available car parks raises the price of parking slots.  Similarly, the financial crisis caused the demand for safe assets to grow sharply and US treasuries were seen as one of the few remaining safe haven assets in the world.

On the investment front, the financial crisis dulled the business sector’s appetite for risk and ushered in an extended period of capital discipline and cost restraint, thus raising companies’ propensity to either hoard cash or pay out higher dividends to shareholders.

Global imbalances have diminished, but...

The IMF has recently re-visited this topic and shown that global imbalances have diminished since peaking in 2006.  Current account surpluses and deficits have narrowed markedly in the past decade; the sum of the absolute values of current account balances has shrunk to 3.6% of world GDP from 5.6% in 2006.  Over this period, the aggregate imbalance of the top 10 deficit countries has dropped by nearly half to 1.2% of world GDP from 2.3%, while the aggregate imbalance of the top 10 surplus countries has declined by one-quarter to 1.5% of world GDP from 2.1% in 2006.  A substantial drop in domestic demand amongst the deficit countries since the financial crisis has been a key driver of their lower deficits.  Nonetheless, at 3.6% of world GDP, the sum of the absolute values of current account balances remains well above the levels that prevailed from 1980-2003. 

The scale of the financial crisis suggests that the healing process is far from over.  Corporate, household and public sectors around the world continue to undertake balance sheet repair, while the slow recovery in nominal GDP across many countries continues to dampen the corporate sector’s appetite for debt, capital investment and new hiring.

Monetary policies in developed countries ought to remain accommodative to address the shortfall in global aggregate demand, revive animal spirits and encourage less saving and more spending, particularly as inflation continues to undershoot central bank targets and cyclical unemployment remains high in most countries.

I’m surprised that the Reserve Bank continues to express frustration at the absence of entrepreneurial risk taking and growth plans across corporate Australia.  After all, top-line growth is weak because the economy remains stuck in a nominal recession; nominal GDP has grown at or below 4% pa in each of the past two financial years, the worst outcome since the early 1990s.  Company results and guidance confirm that animal spirits remain dormant which continues to hinder the much anticipated handover of mining to non-mining capex.  Beset by anaemic revenue conditions, companies justifiably continue to boost profitability by undertaking restricting, selling off underperforming assets, trimming costs and deferring capital spending, and abandoning growth options altogether.

A world of low expected growth and returns = High payout but not higher multiples

Although the reduction in the size of global imbalances is a welcome development, the global saving glut remains with us; excess of desired saving over business investment intentions persists.  This is what bond markets are telling us.  But low interest rates do not necessarily translate into a re-rating of stocks.  From a capital budgeting perspective, the spot risk free rate is low thanks to the factors that are restraining corporate investment: low expected nominal growth and a high expected equity risk premium (ERP).  Therefore, stock multiples should not get an assist from a lower risk free rate given a higher ERP and lower growth prospects .

In a world of low expected capital growth and low expected returns, investors will continue to demand that companies return capital in the form of buybacks and dividends (see my earlier research report, The Cult of Equity).  This obviously does not represent a permanent state of affairs going forward.  Eventually, persistently high payout rates and low retention rates will sow the seeds of the next investment boom as profitable opportunities become more abundant and expected returns from capital expenditure increase.  But the current level of sovereign bond yields around the world and the ECB's timid approach to monetary policy suggests that this remains a way off.

* The charts underpinning the analysis are available on request.

A bright outlook for China's growth prospects and commodities demand

Pessimism is de rigueur among commentators regarding the prospects for China's economy.  GDP growth has slowed from double digit rates to 7.5% in recent years, while prices across most hard commodities continue to slide.

But the Reserve Bank has weighed into the debate with a timely reminder that the long term outlook for Chinese demand for iron ore and steel is bright, underpinned by growing steel intensity in household consumption and residential construction, while China's per capita energy consumption remains low by the standards of advanced economies.

Historically, investment has been steel intensive relative to household consumption.  But as cities grow and incomes rise, steel demand associated with motor vehicle ownership - which remains very low by the standards of advanced economies - should increase (see chart).

Greater motor vehicle ownership will add indirectly to the construction of underground car parks in apartment and commercial buildings.  As the process of urbanisation continues, the construction of taller buildings to accommodate more city dwellers will also lift steel demand.

China's per capita energy consumption remains low by international standards.  The fact that coal dominates China's energy usage is clearly contributing to greenhouse gas emissions and air pollution in most of the country's major cities.  The chart below suggests that there is plenty of scope for renewables, oil and nuclear energy to displace coal over time.

In the short-term, concerns about credit bubbles, the opacity of the financial system, renewed weakness in residential and commercial property markets and the extent to which environmental controls impose constraints on China's growth path will provide plenty of fuel for the pessimists.

While the Reserve Bank communication today didn't address the question of China's sustainable long term growth prospects, there are reasons to be the optimistic thanks largely to catch-up.  At comparable levels of development to China - in terms of GDP per capita relative to the United States - Korea, Taiwan and Japan continued to experience rapid growth for decades.

The pessimists might be winning the battle at present, but there are good reasons to be optimistic about China's longer run growth prospects and demand for commodities, even as the economy re-balances towards more household consumption.

Rumours of the yield trade's demise are greatly exaggerated

In a wide ranging speech given overnight, Glenn Stevens, the Reserve Bank Governor, gave the clearest indication yet that he will not lift the Overnight Cash Rate for an extended period.  The historically low interest rates are justified on the grounds that the economy still has excess capacity and that inflation is likely to remain under control over the next couple of years.

The fact is that Australia has remained stuck in a nominal recession for over two years.  Nominal GDP growth has not risen above 4% pa in each of the past two financial years, the worst outcome since the early 1990s (see chart).  No wonder that consumer confidence remains in the doldrums, revenue growth is weak and animal spirits in the corporate sector are still dormant.

Mr Stevens continues to lament the absence of entrepreneurial risk taking.  While he acknowledges that firms are waiting for more evidence of stronger demand, he suggests that the stronger demand should come from them.  This strikes me as somewhat circular.

Recent communications from the RBA indicate that it is puzzled that non-mining investment remains weak when corporate cash balances are high, gearing is low and Tobin’s q ratio has been growing.  That is, the market value of assets has been growing faster than the replacement cost of assets.

But the value of assets has been rising precisely because companies – beset by persistently weak revenue conditions and weak nominal GDP growth – have been boosting profitability by pulling back rather than expanding.  Gone are the days of chasing the pipedream of double digit revenue growth.  CEOs are now focussed on trimming costs aggressively, restructuring, shedding non-performing assets and deferring or completely abandoning capital projects to cater to investors’ insatiable appetite for income.  Mr Stevens can implore companies to take on more risk but this will continue to fall on deaf years.  The prospect of persistently subdued top line growth suggests that a revival in the corporate sector’s animal spirits is a way off (see chart).

Mr Stevens acknowledges that corporate business models in Australia have effectively been responding to various headwinds – including a high exchange rate – by restructuring and lifting efficiency, and that this has led to a pick-up in growth of productivity.  Indeed, Australia’s productivity renaissance has been evident for a while now (see chart).

Mr Stevens continues to advise caution on the outlook for house prices: prices have risen considerably in Australia’s largest two cities for a while now, they have growing faster than incomes by a decent margin and mortgage lending to investors has registered double digit growth.  Further, the RBA Governor highlights that house prices go up AND down (his capitals, not mine). 

Rightly or wrongly, one of the lessons that the RBA has taken from the past decade is that central banks should no longer be passive actors during periods of asset price inflation, particularly when these episodes are associated with rapid growth in credit.

Mr Stevens faces the dilemma that animal spirits in investor housing is buoyant (which according to the RBA poses a growing systemic risk) while animal spirits remain dormant in the corporate sector.  As long as the RBA continues to under-estimate the power of monetary policy to revive the corporate sector’s animal spirits, the Australian economy will remain stuck in a nominal recession.

From a portfolio construction perspective, this means more of the same and bodes well for the yield trade.  For a number of years now, analysts have been upgrading the growth prospects for large cap, defensive, high yielding stocks relative to cyclical stocks (see chart). 

The tailwind from declining bad & doubtful debt charges will no longer boost bank sector earnings going forward.  Nonetheless, in an environment of low nominal GDP growth and subdued revenue conditions, analysts are unlikely to materially lift their earnings forecasts for cyclical stocks.  Australia’s under-capitalised banking system represents the key risk to the yield trade, but that is not actionable at a time when growth in business credit remains anaemic.

Mea Culpa: Higher capital requirements = Higher bank dividends

In my recent blog post, Too Big To Fail (And Offend), I argued that the politics of banking were such that the bite of the Murray inquiry would be less menacing than its bark, consistent with the experience of financial sector reforms in other countries since the financial crisis. 

One of the reasons I suggested that the government would be reluctant to lift capital requirements substantially was due to their concern that the banks would cut back their dividends, which account for almost one-third of total dividends paid by the ASX200 companies.  In dollar terms, this translates into a chunky $20 billion paid out to bank shareholders in the past year alone.  Any government would be concerned about being blamed for banks cutting back on dividends by self funded retirees and self managed super funds loaded up on high yielding bank shares.

Well, I was wrong on the 'negative' link between bank capital and dividends.  Charles Hyde from Macquarie University has kindly pointed out that forcing banks to finance their loan books with more shareholder equity or loss absorbing capital does not mean that banks need to cut back on dividends.  Contrary to conventional wisdom, bank capital is not an asset; it does not sit idly in a bank's vaults, unlike reserve requirements.  Rather, it is a liability, which together with customer deposits and wholesale debt, is used to finance a bank's loans. 

The key function that a bank performs is maturity transformation.  It carefully manages its liabilities which are liquid with a short duration, and its loans which are illiquid and typically have long duration.  If a bank uses more shareholders equity in its liability mix, in no way is it forced to cut back on loans or dividends.  On the contrary, it can use those additional funds to lend to the household, business and government sectors.  Unfortunately, the terminology used is confusing; capital regulation is a regulation of a bank's liabilities, not its loans or assets.

The causal link between bank capital and dividends might actually run in reverse; that is, more capital enables a bank to pay shareholders sustainably higher dividends.  A bank that holds more loss absorbing capital is more resilient to a decline in the value of its loans, possibly brought about by an economic downturn.  Though the economic cycle, insiders of safe banks should therefore have more confidence to pay higher dividends than banks with less shareholder equity.

The chart below provides strong empirical support for the proposition that safer banks actually more dividends.  There is a statistically robust and positive linear relationship between the dividends to assets ratio on the vertical axis and the leverage ratio on the horizontal axis (ratio of common shareholder equity to assets) for the largest 100 global banks. 

The strong and positive linear relationship is not just unique to the most recent annual estimates used; the regression line was very similar when I re-estimated the relationship using annual estimates from three years ago (not shown here).

It is interesting to note that the four Australian major banks all lie well above the regression line.  This might reflect their focus on commercial banking operations, which have been associated with higher profitability and lower cost to income ratios than offshore banks.  Moreover, Australia's status as one of the few countries in the world with a full imputation system encourages companies to pay dividends.  The regression based on annual estimates from three years ago also shows that Australia's banks were well above the line then too, lending support to the view that higher profitability and imputation have contributed to their higher dividend payout rates.

Total Loss Absorbing Capacity

In a welcome development, the Financial Stability Board recently announced that it is seeking consultation for a common international standard for Total Loss Absorbing Capacity amongst global systemically important banks, which demonstrates a greater willingness to tackle the problem of too big to fail.  But if the pace of reforms since the crisis is any guide, the move to a common global standard will be glacial and probably too lenient.

Despite the compelling empirical evidence that higher capital requirements = higher dividends, the politics of banking still favour the major banks, thanks to their size, profitability and concentrated industry structure.  Although the Murray inquiry might be emboldened by the aggressive language used by the Financial Stability Board in its determination to tackle too big to fail, I still expect the inquiry's bite (and the government's response) to be far less menacing than its bark.    


Too Big To Fail (And Offend)

A recent marketing trip revealed that the main concern portfolio managers have at present is around the banks, particularly the noise made about capital in the lead up to the final report of the Murray Inquiry.  Some PMs are convinced that Murray will recommend that the majors lift their capital requirements substantially and that this will crimp their return on equity and future growth prospects, as well as curtail their ability to maintain their payout ratios.

Further stoking those concerns, Wayne Byres, the Chairman of the Australian Prudential Regulatory Authority, has recently drawn attention to the fact that rapid growth in mortgage lending in the past decade – home loans account for 65% of their loan books, up from 55% - has given the banks a tremendous free kick in terms of boosting their capital ratios.  Risk weighted assets, the widely used denominator in capital ratios, has lagged growth in total assets because mortgages attract lower risk weights than business lending (see chart).

Consequently, the alternative (and more robust) leverage ratio – which uses total assets as the denominator - has lagged capital ratios based on risk weighted assets.  In fact, the leverage ratio remains slightly below historical trends (see chart).  The banks have likely engaged in gaming of the risk weighted assets framework to economise on shareholder equity.

LeverageRatio.jpg

The complicated politics of banking

I believe that the Abbott government is pleased that Murray is rattling the cage around banks and capital, without rattling the cage too much.  After all, the methodology used by Murray suggests only a small increase is necessary for Australia’s majors to converge on Core Tier 1 capital ratios of global peers.

Despite the community backlash against the banks (and financial institutions more broadly) in the wake of the financial crisis, the politics of banking favour the major banks; they make generous contributions to both political parties, have well-funded lobby groups and paid out $20 billion in dividends to shareholders in the past year, accounting for one-third of total dividends paid by the ASX200 companies.  Imagine the uproar from self-funded retirees and self-managed super funds loaded up on high yielding bank shares, if Murray recommended a substantial lift in capital which would cause the banks to cut back on dividends.

Also note the government’s decision earlier this year to not implement a key recommendation from the Senate Inquiry into the performance of ASIC, to undertake an independent inquiry into the conduct of the Commonwealth Bank’s financial planning business.  Evidently, the major banks are literally too big to fail (and offend).

I am very sympathetic to the view that the majors need to finance a significantly larger share of their loan books with more common shareholders equity.  The Australian system remains significantly under-capitalised and a crisis of confidence will likely expose the vulnerability that banks simply do not have adequate loss absorbing capital and rely too heavily on borrowed funds in their mix of liabilities (for more detail, see my recent blog post, An open letter to Mike Smith and Lindsay Maxsted).  This represents a key longer-term, not actionable at this point in time.

Despite the noise made around capital, a number of factors should continue to support the sector in the near term.  Valuations don’t look stretched (the sector is trading at a 10% discount to the market, in line with the historical median), the aggregate payout ratio of 70-75% is in the historical range and BDD charges are likely to remain low as long as business credit is weak and animal spirits remain dormant (my base case considering that Australia remains stuck in a nominal recession).  For more detail, see my recent blogpost, The great complacency.

Against this backdrop, I would use any renewed price weakness of the major banks in the lead up to Murray’s final report as an opportunity to take a tactical overweight in the sector.  The first key signpost to shift to a neutral to underweight position in the sector is a re-acceleration of business credit, but that remains a way off while the corporate sector’s animal spirits remain dormant and the ASX200 companies continue to face persistent revenue headwinds (see chart).

Murray Inquiry: More bark then bite

Since the financial crisis, governments and prudential regulators around the world have demonstrated an inability and unwillingness to seriously confront banks about capital and tackle the problem of too big to fail.  There has been little appetite for governments to undertake an upheaval of capital regulation and to protect taxpayers from remaining on the hook for banks' excessive risk taking.  As has been the case with financial sector reform across other countries since the crisis, the bite of the Murray Inquiry promises to be far less menacing than its bark.  Which is a shame, because it will represent a missed opportunity to create a resilient financial system.  That much will become obvious in years to come.

A Rattled BOJ Rightly Responds

The Bank of Japan has clearly been rattled by the setback to the economic recovery associated with April's consumption tax hike to 8% from 5%.  The Tankan survey of business sentiment has since declined, nominal GDP posted its first quarterly decline since mid-2012 and the core CPI has stalled for the first time this calendar year.

In a narrow majority decision, the BOJ voted to accelerate growth in the monetary base by no less than 20% per annum compared with the past, and scale up its purchases of JGBs by around 60% per annum.  The scale of the expansion in the BOJ's quantitative easing is ambitious but justified in light of the faltering recovery. 

The expansion of its program of QE should be welcomed by investors given the unambiguous success that the more aggressive conduct of monetary policy has had since the inception of Abenomics in: ending deflation, boosting inflation expectations, underpinning yen weakness, raising the level of nominal GDP (although it remains well below its pre-GFC peak) and boosting the stock market primarily through analyst upgrades to corporate sector profitability (see charts).

The BOJ is clearly looking ahead to the next consumption tax hike to 10%, slated for October 2015, and will remain proactive in ensuring that monetary policy will help to offset any renewed weakness in sentiment and aggregate demand.

The BOJ's expansion of QE is a timely reminder that it remains committed to achieving its price stability target of 2%pa, that global liquidity will continue to be abundant and that the yield trade has not yet run its full course.


Credit aggregates confirm that Australia remains stuck in a nominal recession

The credit aggregates confirm that animal spirits in the household and business sectors remain dormant.  Despite solid growth in September, the stock of business credit has taken almost six years to reach its pre-GFC peak. 

Faced with persistent revenue headwinds and investors' insatiable appetite for income, the ASX200 companies continue to undertake restructuring, defer capital spending where feasible, sell or de-merge under-performing and non-core assets,  and trim costs aggressively to boost profitability and return capital to shareholders.  Although this is a welcome development to shareholders and imposes a discipline on capital allocation decisions, it accounts for the reluctance of CFOs to lift gearing to fund expansion and is contributing to a shortfall in aggregate demand. 

Small to medium sized businesses have probably also suffered credit constraints due to the risk weighted asset methodology widely used by banks, which encourages lending to 'safer' mortgages over 'riskier' business loans.

The household sector's animal spirits also remain dormant.  Personal credit has been stagnant in the past year, and remains 10% below its pre-GFC peak, which is anaemic considering the population boom that Australia has undergone.  During this period, Australia's population has ballooned by almost 2 million people or 10%.

House prices and low interest rates are clearly encouraging much needed investment into housing construction, with both owner occupier and investor housing credit growing strongly (see chart).  The rapid growth of the investor segment - obviously a source of concern to the RBA - would not pose a systemic risk if the banks had more loss absorbing capital.  At present, the majors typically finance $100 of assets with less than $8 of common shareholder equity compared to $50 of equity for the typical non-financial company in the ASX200.

The RBA Governor continues to under-estimate the power of monetary policy to revive the corporate sector's entrepreneurial risk taking and lift expectations of revenue growth.  Against this backdrop, the September credit aggregates suggest that it will be a while yet before the Australian economy pulls out of its nominal recession.


The Great Complacency

Australia’s major banks have continued to defy expectations, and remain on track to deliver stronger returns than the broader market for the fourth consecutive calendar year, although the outperformance has narrowed somewhat this year.

In recent years, earnings expansion rather than multiple expansion has underpinned bank sector outperformance.  Analysts have lifted their EPS forecasts by more than 15% since the start of 2013, at a time when resource sector forecast earnings have continued to be downgraded against the backdrop of falling commodity prices (see chart).  But the bank upgrades have slowed in recent months.

Despite widespread concerns in the investment community that the yield trade has run its course, I believe that the bank sector will continue to offer outperformance in the near term for a number of reasons: loan loss provisioning is likely to under-shoot analysts’ expectations, the sector valuation is not stretched, and the dividend payout ratio is in the historical range.

But over the medium term, investors should be cautious on the sector due to the great complacency; the sector’s index weight remains close to an historical high of 30% and Australia’s banking system remains undercapitalised, and will remain so even if the government embraces the Murray Inquiry’s interim recommendations for a modest rise in capital ratios.

No mean reversion in BDD charges while corporate capital structures remain conservative

Ongoing declines in cost to income ratios and bad & doubtful debt charges have helped to boost bank sector EPS forecasts over the past two years.  Cost to income ratios are low by global standards, which have benefited from a focus on mortgage lending, while loan loss provisioning has dropped to below 0.25% of total loans, which is below historical trends.  But bad & doubtful debts have remained below the long term median and mean estimates for extended periods before (see chart).

The already low level of BDD charges is unlikely to give bank sector earnings the same tailwind as in recent years.  But as long as animal spirits remain dormant and CFOs are still reluctant to lift gearing, provisioning should continue to surprise on the downside, particularly for those analysts projecting BDD charges to mean revert over the next three years.

Bank valuations don’t look stretched

The sector is trading on 12.4 x 12mth forecast earnings, which represents a 10% discount to the broader market (13.8x), in line with the historical norms (see chart).

The sector’s payout ratio remains in the normal range

Despite rapid growth of dividends in recent years, the bank sector’s payout ratio has remained below 75% for a while now.  Indeed, analysts’ upgrades to EPS forecasts over the past two years have outstripped their DPS projections (see chart).

Historically high index weight

A long run perspective shows that the bank sector’s index weight remains close to a record high of 30% (see chart).  This has been a poor contrarian forward looking indicator for performance in recent times; the sector’s index weight has been at, or close to a record high since mid-2012.  Nonetheless, the high index weight which contributes to the high concentration of Australia’s stock market, points to a growing complacency and longer term tail risk.

BankIdxWeight.jpg

Australia's banking system to remain under-capitalised

The Murray inquiry’s draft report helped to dispel the notion that Australia’s major banks are well capitalised by global standards.  Nonetheless, the preferred capital ratio used in the draft report points to only a modest rise in the sector’s capital requirement.  Based on the leverage ratio – which replaces risk weighted assets with total assets in the denominator – Australia’s major banks remain 200 basis points below the global median (see chart).

globalMedian.jpg

The bank sector’s razor thin loss absorbing capital means that there is a growing risk that they might not be able to withstand even a small decline in the value of their loans, and that fire sales of assets will have knock on and contagion effects on other banks and financial institutions.  The associated crisis of confidence will expose the great complacency. 

The near-term risks are low because corporate sector balance sheets remain in excellent shape.  But investors should look to move underweight the banks when there is growing evidence that animal spirits are reviving, reflected in a sustained pick-up in growth of business credit.  This however remains way off, given that the Reserve Bank continues to under-estimate the power of monetary policy to boost entrepreneurial risk taking.

NAB remains the laggard on profitability

At the stock level, NAB remains the laggard on profitability.  The stock’s forecast profitability remains 10% below the pre-GFC peak, while each of the other banks have had their EPS estimates upgraded over this time by no less than 10% (see chart). 

BankEPS.jpg

NAB’s poor track record on profitability appears to reflect slow growth in its net asset base compared to the other banks.  In the past decade, it has expanded its book value per share by only 20% (see chart).

BankBPS.jpg

Dear Mike and Lindsay, Please Refrain

Dear Mike and Lindsay, I have noticed that each of you recently has recently defended Australia’s financial system, arguing that the banks are well capitalised.  Mike, you suggest that Australia’s banks are holding twice as much capital as they did prior to the financial crisis.

Although Australia’s banks have doubled their equity capital since prior to the crisis to over 140 billion dollars, you do not draw attention to the fact that banks have doubled the loans they have written over this period.  So the ratio of tier 1 equity capital to total assets has broadly remained steady at sub-5% since 2006.

Of course, you both would retort that the denominator used in conventional capital ratios is not total assets but risk weighted assets.  Indeed, banks have lifted their aggregate ratio of tier 1 equity capital to risk weighted assets by over 300 basis points since prior to the crisis to currently stand at over 10%. 

By conferring different risk weights on different assets, risk weighted assets are designed to penalise banks more for writing risky business loans than residential mortgages that are considered to be safer.  But the pitfalls and arbitrariness of using risk weighted assets is reflected in the fact that Basel for instance conferred zero risk weights to European sovereign bonds, including Greece. 

The chart below shows the large and growing divergence between the banking system’s total assets and risk weighted assets since the crisis, thanks largely to the rapid growth in mortgage lending during this time which attract lower risk weights, while business lending has been stagnant. In order to economise on the need to build capital, I wonder whether the banks you represent (and the other majors) have effectively gamed the Basel risk weightings and deliberately pursued a strategy of mortgage led growth?

Thus, the significant lift in the banks’ capital ratios is an illusion when the more robust measure of total assets is used instead of risk weighted assets as the denominator.

rwa.jpg

Demystifying bank capital

I’m also concerned at the language you (and other bankers) continue to use when discussing capital regulation.  Why do you continue to propagate the myth that banks in some sense ‘hold’ capital.  The implication of course is that capital requirements compel banks to set aside capital in their vaults that acts like a drag on your balance sheets that could otherwise be used to supply credit to growing businesses and households.

Now Mike, you know quite well that this is a fictitious tale that bankers spin.  In fact, bank capital has nothing to do with a bank’s assets.  Rather, capital lies on the right hand side of a bank’s balance sheet, among liabilities.  Banks fund loans from three sources: they borrow from customers in the form of deposits, they borrow from creditors in the form of long and short term wholesale debt, and they raise equity from shareholders or retained profits.  Equity or bank capital is effectively loss absorbing capital and so represents un-borrowed funds because shareholders are only residual claimants to a bank’s cash flows.

Capital regulation simply requires banks to use a minimum amount of loss absorbing capital to fund its loan book.  Contrary to what you both say Mike and Lindsay, a financial system whose balance sheet is funded with more loss absorbing capital is a safer financial system.

You both (and other bankers) have pointed out that higher capital requirements hinder the ability of banks to lend and would lead to higher lending rates.  But if there are profitable opportunities to lend, there is nothing to stop you from raising more equity or reinvesting more profits and putting the additional funds to work by writing more loans.

I’ve heard the refrain from bankers before that equity is too expensive, right?  Finance academics, Anat Admati and Martin Hellwig, do a splendid job of exploding this myth, by drawing on the Miller-Modigliani theorem developed over half a century ago, which shows that more gearing does not offer companies a free lunch.  That is, loading up on leverage does not indefinitely reduce a company’s cost of capital.  Indeed, more leverage raises a company’s default risk.  Conversely, a bank that raises more equity or loss absorbing capital is associated with lower risk and expected return because it can better withstand a decline in asset values.

If equity is so expensive, why doesn’t the typical non-financial listed company in Australia – which has a capital ratio of around 50% - exploit the free lunch too?  Clearly, there is no arbitrage available because non-banks do not benefit from a government guarantee.

The argument that subjecting banks to more stringent capital requirements would lead to higher lending rates confuses private and public costs.  Banks get away with using less than $10 of equity capital to fund every $100 of assets thanks the taxpayer funded guarantee, which allows banks to borrow at cheaper rates.  If the requirement for a bank to have more loss absorbing capital led to a lift in lending rates, it would reflect a higher private cost incurred by the bank and its shareholders.  But the cost borne by the taxpayer and society more broadly would be lower thanks to the benefits of a safer financial system that is less vulnerable to crises of confidence.

Race to the bottom

Lindsay, you believe that Australia’s bank capital ratios are already in the top quartile compared to other banks around the world.  On the same theme Mike, you have expressed concern that more increases in bank capital suggested by the Murray Financial System Inquiry is unnecessary and would further tilt the playing field against Australia’s banks and lead them to being globally uncompetitive.

This might sounds like a seductive argument to some, but a race to the bottom in capital ratios across different jurisdictions has undermined the resilience of the global financial system and led to its near collapse less than seven years ago.

Based on a robust capital ratio metric of common equity to total assets, the Australian majors lie well below the global median (see chart).  Based on the current value of their assets, Australia’s banks would need to raise an additional $60 billion to reach the global median of 8%, which is the equivalent of over three years of the sector’s dividends.

Given the importance of the banking system to Australia’s stock market and the economy, and the sector’s high concentration, it is reasonable to expect Australia’s banks to have capital ratios that are above the global median, to safeguard the system and protect taxpayers.  Moreover, the analysis contained in Anat Admati and Martin Hellwig’s excellent book, The bankers’ new clothes, implies that the global median capital ratio remains woefully inadequate.

The financial crisis: An ongoing burden for the taxpayer

Mike and Lindsay, you both agree that Australia’s banks successfully navigated the financial crisis, which you argue represents a big tick for the safety of the financial system.  But surely this belies the taxpayer funded support that ultimately safeguarded the financial system, specifically the first time introduction of explicit depositor protection in Australia, in the form of the Financial Claims Scheme.

Lindsay, you express a desire for a strong financial system and warn against a narrow focus on bank capital by the Murray financial system inquiry.  Well, the most effective way to build a secure financial system is for the banks to fund a larger share of their total assets (and not the nonsense of risk weighted assets) with common equity.  In fact, reform of Australia’s financial system should really be largely about bank capital.

Mike and Lindsay, in your respective roles as CEO of ANZ and Chairman of Westpac, no-one expects you to represent or defend the interests of the Australian taxpayer.  But please refrain from propagating myths about bank capital.  Because by continuing to narrowly promote the interests of your shareholders, the risk is that the next crisis of confidence will expose the fragile and still under-capitalised domestic banking system.

The Lost Decade for Australia's Discretionary Retailers

Glenn Stevens has drawn the line in the sand over the past six months, first by observing that entrepreneurial risk taking has been absent then imploring businesses to abandon their cost and capital discipline to embrace pro-growth strategies.  

Analysts should therefore be looking for signs of a revival in the corporate sector's animal spirits as a guide to the date of lift-off in the Overnight Cash Rate.  Regrettably, the recently released credit aggregates showed that business credit was flat in August and only 3% higher than a year earlier, confirming that the corporate sector remains reluctant to lift gearing against the backdrop of the new capital discipline. 

The Reserve Bank Governor's anxiety is understandable considering the imminent investment cliff in mining and energy over the next two years as the construction of LNG processing plants approach completion. 

But does Mr Stevens seriously expect the non-mining sectors to ramp up their investment intentions at a time when they face persistent revenue headwinds?  Unfortunately, the RBA continues to under-estimate the power of monetary policy to revive the corporate sector's animal spirits, to boost company revenues and lift expectations of growth in nominal GDP.

The ongoing weakness in consumer sentiment and the recently released August retail trade data suggest that the consumer's animal spirits also remain dormant.  To put the retail trade survey in context, by excluding items such as services, petrol, motor vehicles and utilities, it accounts for less than one-third of total household sector spending. 

Despite its narrowness, it represents an invaluable guide toconsumer sentiment because it includes durable goods - such as PCs, washing machines etc - that households tend to buy when they are feeling optimistic and secure about their financial future. 

I have further narrowed the survey to capture the three categories that listed discretionary retailers are most exposed to: household goods retailing; clothing, footwear & personal accessories; and department store sales.  The chart below shows that discretionary spending across these three categories in aggregate has almost come to a stand still since the end of 2007 after growing at a strong compound annual rate of almost 7% in the preceding decade.

In contrast, the other components of the retail trade data - mainly spending on food as well as cafes & restaurants - has also slowed over the past seven years, but this has been more moderate.  Clearly, discretionary retailers have been more exposed to revenue and competitive headwinds than consumer staples.

AggregateRetailSpend.jpg

The pattern of discretionary spend is dreadful considering that Australia has experienced a population boom over the past seven years, adding around 2 million people or 10% to its population.  Consequently, discretionary spend has declined to $910 per person, down from its 2008 peak of $950 (see chart). Persistently weak labour market conditions have not helped, with aggregate hours worked remaining stagnant for three years as companies continue to undertake restructuring and trim costs to offset anaemic revenue conditions.

AggregateRetailSpend1.jpg


Growth in all three components of discretionary spending have materially slowed since the financial crisis, but department store sales has remained the laggard (see chart).  The chart below also reveals that in the past year, household goods retailing has lifted at a time when department store sales and spending on clothing, footwear & personal accessories has gone backwards.

DiscretionaryComponents.jpg


The consumer's dormant animal spirits and intense retail competition (particularly from e-tailers) are reflected in the fact that sell-side analysts have not lifted their EPS projections for the discretionary retail sector for over four years now (see chart).  Indeed, the sector's forecast profitability is at the same level it was in 2005.  This has clearly been the lost decade for Australia's discretionary retailers.  Valuations are not compelling at current levels, with the sector trading slightly above its historical median of 13 times twelve month forward earnings.

RetailIGDecomposition.jpg


The consumer environment headwinds that have beset the sector have put a premium on stock picking to generate alpha.  The two key outperformers in the past year have been Harvey Norman and Premier Investments, with analysts lifting their ROE projections for both stocks by over 10% (see chart).  Wotif.com still enjoys the highest ROE and book multiple but analysts have significantly scaled back their earnings forecasts for the stock in the past year. Despite this, the stock still trades a material ROE adjusted book premium relative to discretionary retailers.

RetailROEAdjustedPTBV.jpg

The consumer environment has deteriorated in recent years thanks to weak labour market conditions and increased job insecurity.  This has been reflected in a decline in permanent incomes or the present value of human capital, due to a lift in the discount rates that households apply to their future income stream.  Little surprise then that households have undertaken balance sheet repair and lifted their savings rate.

The revenue headwinds that have beset discretionary retailers are unlikely to change given intense competition from e-tailers and the Reserve Bank's timid approach to monetary policy.  As with its attitude towards entrepreneurial risk taking, the RBA continues to under-estimate the ability for monetary policy to revive the consumer's animal spirits.  Discretionary retailers therefore need to accept that a cautious consumer represents the new normal for now, and that trimming costs, lifting productivity and consolidating without undermining their service offering represents the most effective way to offer better returns to their long suffering shareholders.


Macquarie Group: Heads I Win, Tails You Lose

Confirmation that Nicholas Moore’s $12 million pay cheque has made him among the highest paid CEOs in corporate Australia risks giving rise to a renewed backlash against what many consider to be excessive CEO pay, particularly for CEOs that preside over financial institutions that benefited from taxpayer funded support during the financial crisis.

This is not to deny the fact that Macquarie Group has given its shareholders plenty to cheer about in recent times.  In the three years to June, Macquarie delivered total shareholder returns of over 125%, among the top 10 in the large cap universe.

But taxpayers and Macquarie shareholders are entitled to ask whether Nicholas Moore and his senior executive team are really worth it.  After all, Macquarie shareholders would have been better off invested in the broader market over the past seven years.  Since its pre-GFC peak in 2007, Macquarie has posted a total shareholder return of close to zero, well below the 10% delivered by the broader market. 

Macquarie shareholders are also entitled to feel let down by some creative and astute lowering of hurdle rates associated with the company’s performance based remuneration.  Two important changes made in 2013 were a reduction in the EPS growth target range to 7.5%-12% from 9%-13% and a change in the peer group of companies for the ROE hurdle, which excluded the Australian major banks.  The new peer group was composed entirely of US and European investment banks, which have materially lower ROEs than the Australian majors.

According to Thomson Reuters, Macquarie Group posted an ROE of around 10% in its most recent full year result, which looks like a stellar outcome when compared to the median of 4.5% for the new comparator group but is broadly in line with the median of 8.5% of the old peer group.  The changes to the hurdle rates effectively have added millions to the pay packets of Nicholas Moore and his senior executive team in the past year.

Shareholders should also question the relevance of comparing Macquarie’s ROE to a peer group of global investment banks when funds management has emerged as the key driver of the group’s profit, generating a pre-tax profit of over $1 billion in their latest full year result, well above the combined profit of $830 million delivered by the Securities and FICC divisions.  Moreover, the market is increasingly pricing the stock as an asset manager and less as an investment bank.

The annuity style income that the Funds group offers is a welcome development for the company at a time when investors have an insatiable appetite for income, and is a credit to the management’s foresight years ago to diversify its traditional heavy reliance on the cyclical and capital hungry investment banking businesses.

Nonetheless, the new dominance of funds management within the group represents a practical problem for the purposes of setting CEO pay, because Macquarie’s ROE falls well short of that achieved by other listed global asset managers.  Macquarie’s ROE of 10% is well below the median of 17% among the largest 20 global asset management firms.  The likes of BlackRock, T Rowe Price, Invesco and State Street posted ROEs above Macquarie in their most recent full year results.  Would you really expect senior management at Macquarie to adopt a new peer group of companies for its hurdle rates that delivers consistently higher ROEs? 

This also raises an important philosophical question about whether Macquarie Funds is better off without being burdened by the low ROE, low multiple investment banking divisions.  It is far from clear whether housing the distinct businesses of investment banking and asset management under the same roof generates any synergy benefits. 

As far as taxpayers go, there is little doubt that the Rudd Government’s decision to introduce formal taxpayer funded depositor protection in the form of the Financial Claims Scheme in 2008 helped to restore confidence in Australia’s financial system and effectively safeguard the likes of Macquarie Group and other financial institutions.  But taxpayers' patience is rightly wearing thin when it comes to the asymmetric payoff that Macquarie offers of heads I win, tails you lose.

Despite Basel III rolling out tougher global capital requirements, Macquarie still holds less than $10 of equity capital for every $100 of assets.  In contrast, Australian non-bank companies typically hold around $50 for every $100 of assets.  This woefully inadequate level of bank capital arises due to taxpayer funded depositor protection.

At a time when the Murray Inquiry is putting a microscope over the governance at financial institutions, the revelation that senior Macquarie executives are richly rewarding themselves warrants greater scrutiny by shareholders, taxpayers and policy makers alike. 

Macquarie should think seriously about the longer run impact on its reputational risk if senior executives continue to enjoy the spoils in good times but expect taxpayers to foot the bill for its excessive risk taking in bad times.  That does not represent a sustainable social pact.