Weekly Impressions - Deleveraging dynamic blunts China's Monetary easings

Central bank communications and actions dominated financial market developments over the past week.  The European Central Bank’s President re-iterated the bank’s willingness and ability to use all instruments within its mandate if warranted.

What specifically sparked the rally in global equity markets was Mr Draghi’s acknowledgement that the degree of monetary policy accommodation would need to be re-assessed at the December monetary policy meeting, thanks to downside risks to the outlook stemming from concerns over growth prospects in Emerging Markets and related developments in financial and commodity markets.  Although Mr Draghi cited these concerns at the September press conference, at that time, he suggested that it was too early to assess whether these developments would be transitory.

The shift in Mr Draghi’s rhetoric at last week’s press conference confirms that that the ECB assesses that the risk has increased that these developments – if left unaddressed - could have a long lasting impact on the outlook for prices.

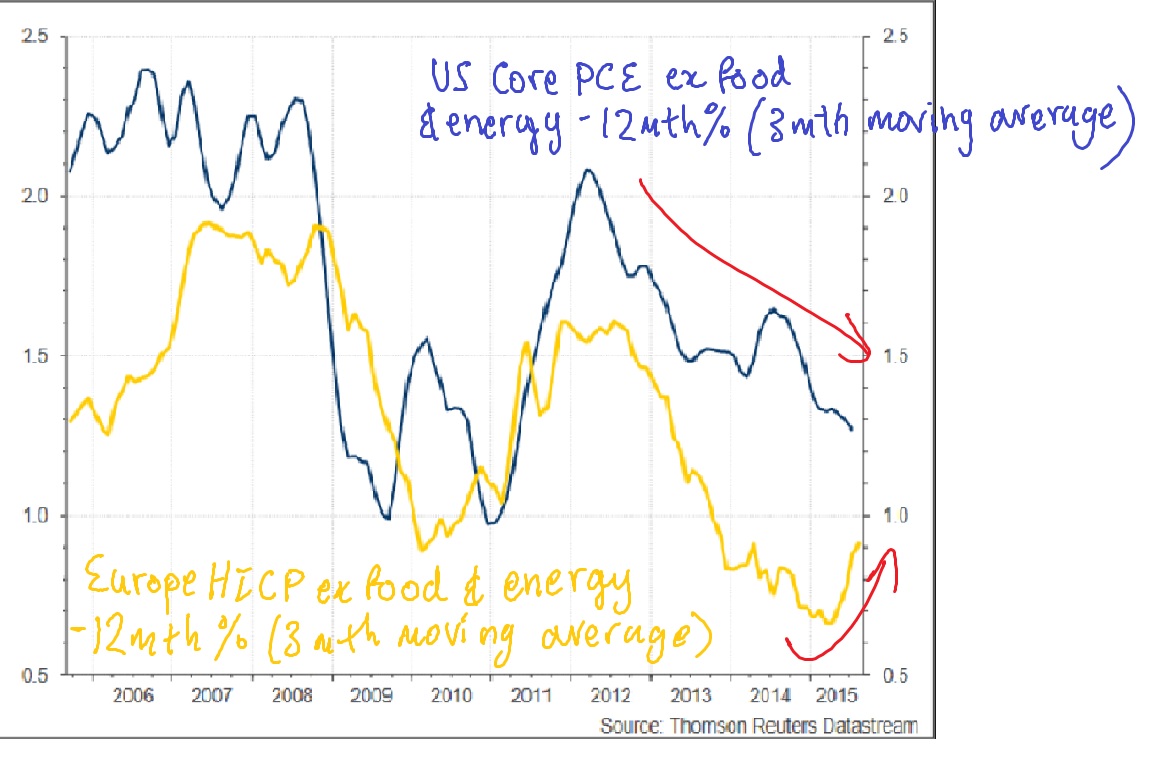
Core inflation has undershot the ECB’s target for the past decade

On that measure, the ECB’s more aggressive rhetoric and stimulus this year reflects a belated acknowledgment that it should receive a fail for its continued inability to meet its inflation target, which is to achieve an inflation rate below but close to 2% over the medium term.  Over the past decade, the core Harmonised Index of Consumer Prices has consistently failed to get anywhere near 2%, with the exception of 2007 and 2008 (see chart).  Although inflation has picked up this year, the year-on-year rate still doesn’t have a 1 in front of it.

The strength and persistence of global disinflationary forces since the financial crisis suggests that the ECB will need to extend (and probably expand) the asset purchase programme to beyond September 2016.  Expect global equity markets to rally on this announcement.

As an aside, the ECB’s inflation target is too high.  Once the upside bias in the measurement of consumer price indices is taken into account – particularly the rapid innovation in the provision of IT and related services – a 2% inflation target translates into modest deflation.  Evidente will explore this in more detail in a forthcoming research report.

Someone forgot to tell global stock markets about ‘currency wars’

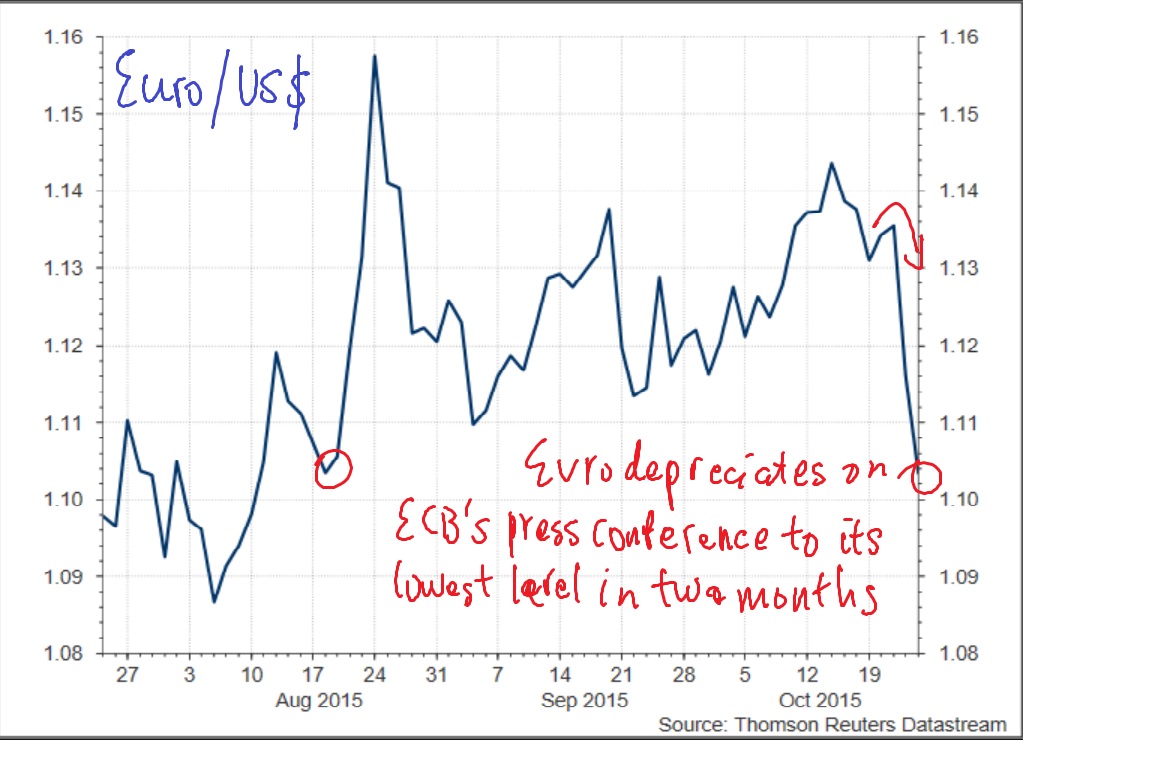
The euro depreciated against the US dollar by 3% on the announcement to its lowest level in two months (see chart).  The zero sum game embedded in ‘currency wars’ predicts that outside of Europe, stock markets should have fallen on the ECB’s announcement due to adverse effect of euro depreciation on the competitiveness of non-European exporters.  But not only did European stock markets rally strongly but so did global stocks, including stock markets in the United States.  The overwhelming weight of evidence supports the view that monetary stimulus works by boosting consumption and investment, not net exports.

WI1025-EuroDepreciation.jpg

Deleveraging dynamic blunts China's policy easings

China’s central bank cut its 1 year benchmark bank lending rate by another 25 basis points to 4.35%.  This represents the sixth cut in twelve months, bringing the cumulative decline to 165 bps since November 2014 (see chart).  The benchmark deposit rate was also cut by 25 bps to 1.5% and the reserve requirement ratio (the amount of reserves held be banks) was reduced by 50 bps for all banks. 

The additional policy stimulus is designed to moderate the continued slowdown in various activity indicators, including fixed asset investment and industrial production (see chart).

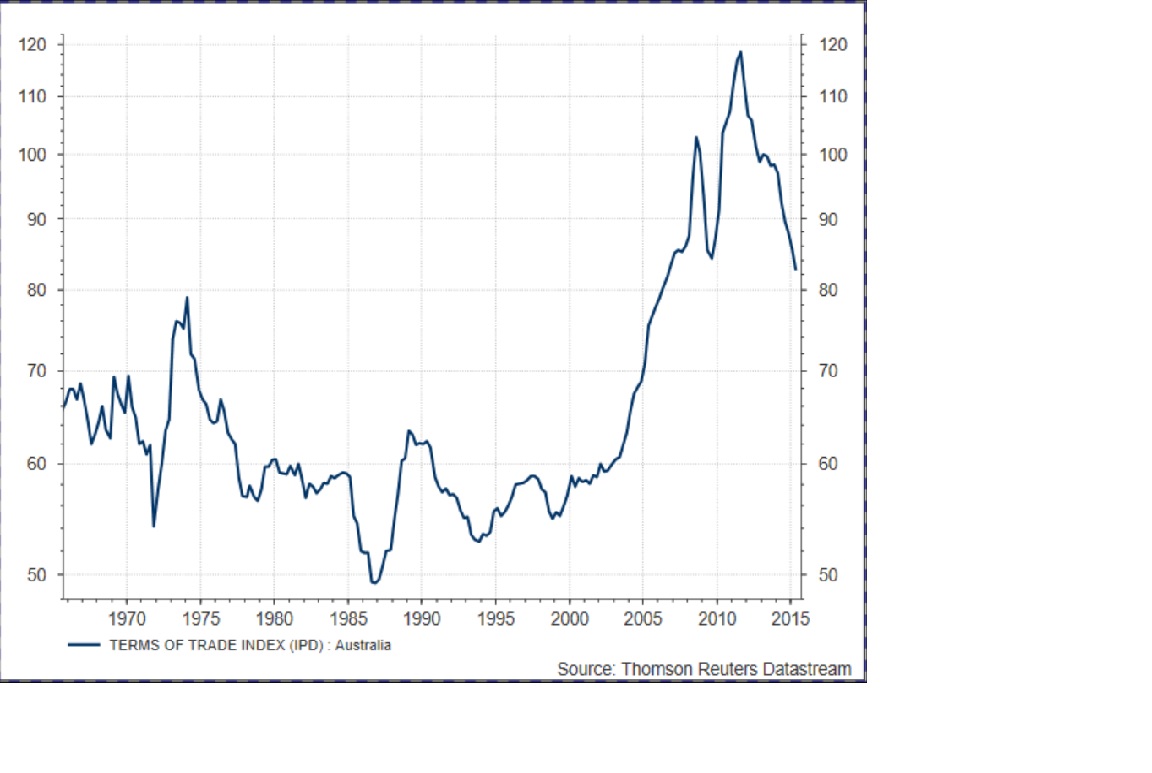
Growth in industrial production has been particularly weak for construction related products.  Steel industry conditions remain weak, with domestic production having moderated.  Against this backdrop, domestic iron ore production and iron ore imports (including those from Australia) have trended lower (see chart).

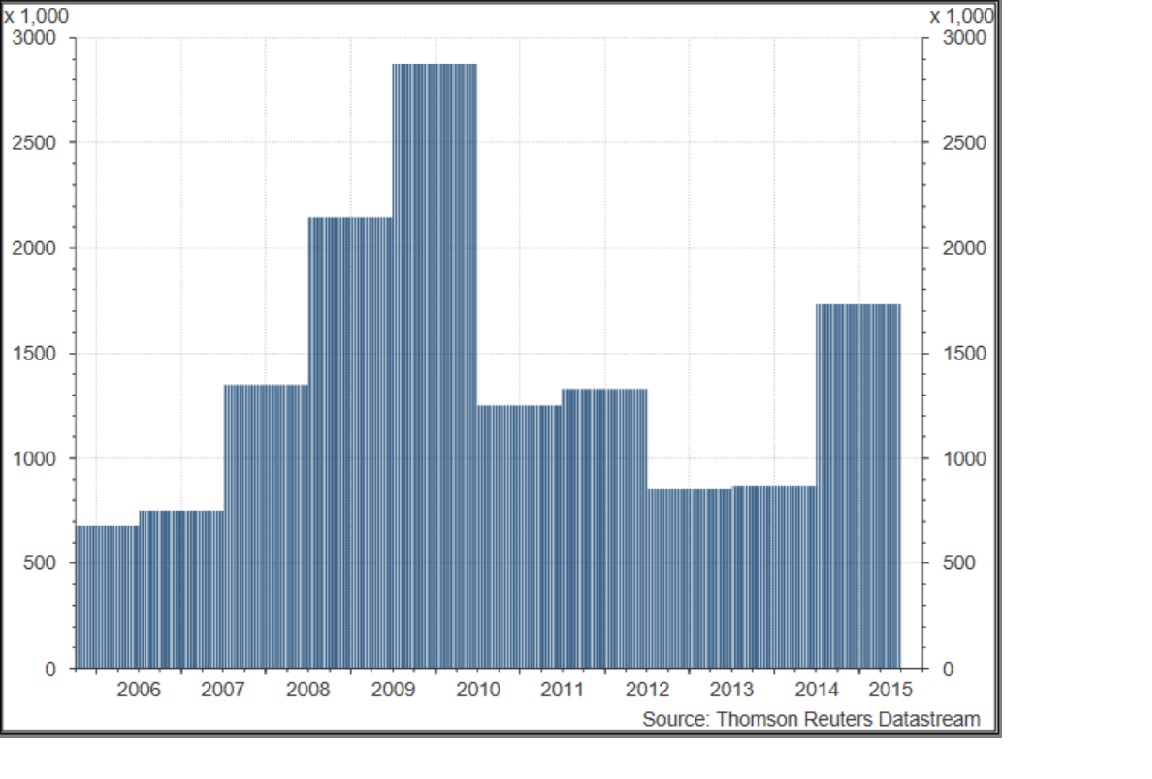
The policy easing thus far has done little to mitigate the ongoing deleveraging dynamic in China.  Growth of total social financing continues to moderate due primarily to a sharp slowdown in off-balance sheet financing activity, reflecting both cyclical and regulatory developments (see chart). 

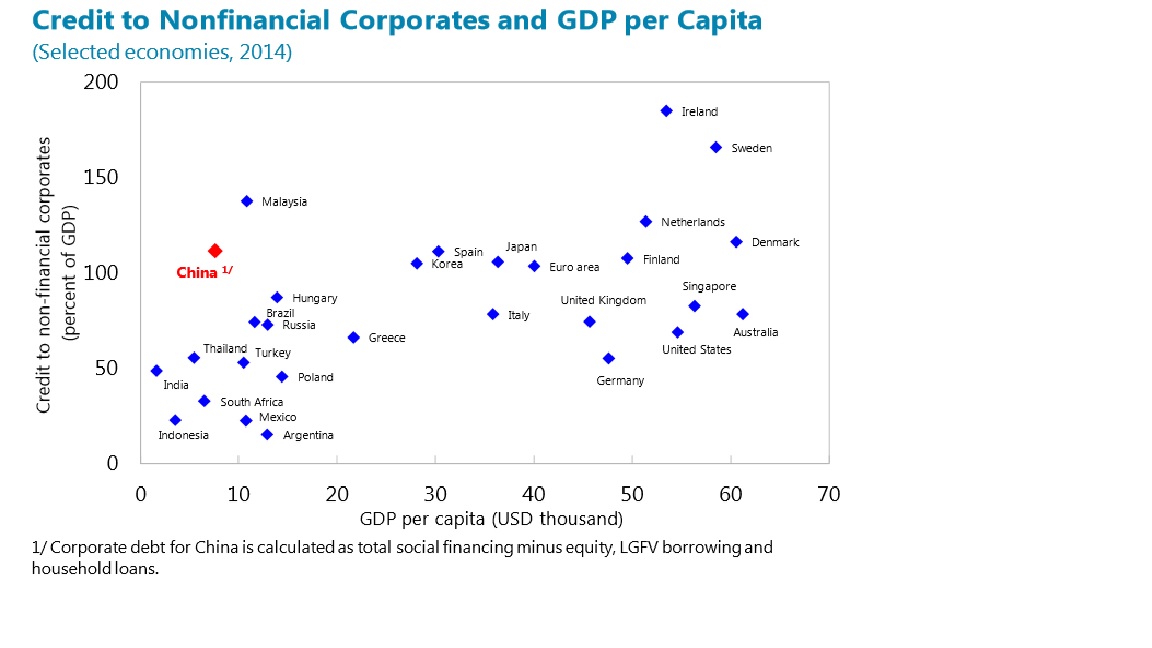
A number of other key developments are weighing on activity and working to blunt the efficacy of monetary policy in China: low efficiency of investment, the decline in corporate profitability, lower interest coverage ratios for SOEs and other excess capacity sectors even as interest rates decline, and the high debt burden of the non-financial corporate sector (see chart).


Dear Mr Hartzer, Please Explain

Dear Mr Hartzer,

In the press release accompanying the announcement on October 14th, that Westpac would be undertaking a $3.5 billion rights issue, you state that “capital raised responds to changes in mortgage risk weights that will increase the amount of capital required to be held against mortgages by more than 50%...to be applied from 1 July 2016As a result, Westpac has also announced an increase in its variable home loan (owner occupied) and residential investment property loan rates by 20 basis points.”

Demystifying the myth that capital sits idle in bank vaults

There are two parts of this statement that I do not understand.  The first is a myth that is commonly propagated by bankers; the notion that a bank must ‘hold’ capital, the implication being that it sets capital aside that burns a hole in a bank’s balance sheet while it sits idly in a vault.

This is far from reality.  Let’s start by quantifying the incremental capital requirement.  You’re correct in stating that the capital requirement for mortgages will be 50% higher from 1 July 2016.  At present, the Internal Ratings Based (IRB) risk weights assigned to residential mortgages is around 17% on average for the major banks.  In July 2015, APRA announced that for banks accredited to use the IRB approach, the average risk weight on Australian residential mortgage exposures would increase to at least 25% by mid-2016.  This is designed to narrow the competitive advantage that the IRB accredited institutions (notably the major banks and Macquarie Bank) have over authorised deposit-taking institutions (ADIs) that must use standardised weights.

For ADIs using the standardised approach, risk weights are prescribed by APRA.  The average risk weight for residential mortgage exposures under the standardised approach is around 40 per cent (see chart).

The current IRB accredited risk weight of 17% on a $600,000 home loan equates to a risk-adjusted exposure of $102,000, so a bank would need to allocate $10,200 in additional equity finance to achieve a capital ratio of 10% of risk-weighted assets.  Under APRA’s new guidelines from mid-2016, the new capital requirement increases to $15,000 for the same size mortgage, but remains well below the $24,000 that applies to non-IRB ADIs (see chart).

The nonsense that banks need to ‘hold’ or set aside capital stems from the misconception that bank capital is an asset like reserve requirements.  Bank capital is a liability, which together with customer deposits and wholesale debt, is used to finance a bank's loans.

As you would well be aware Mr Hartzer, the key function that a bank performs is maturity transformation.  It carefully manages its liabilities which are liquid with a short duration, and its loans which are illiquid and typically have long duration.  If a bank uses more shareholders equity in its liability mix, in no way is it forced to cut back on loans or dividends.  On the contrary, it can use those additional funds to lend.  Unfortunately, the terminology is confusing; capital regulation is a regulation of a bank's liabilities, not its loans or assets.

The folly of linking lending rates to capital structure

Which brings me to the second part of your statement that puzzles me; that Westpac has lifted its variable home loan rates in response to the new capital requirements.  This might not be unprecedented but it is highly unusual for a company to link price hikes to the need to use more loss absorbing capital in its liability mix. 

In recent months, a number of ASX listed companies have undertaken rights issues to shore up their balance sheets, including Myer and Origin Energy.  Yet despite the rights issues, Myer did not announce its intention to lift profit margins to fund the incremental capital raised and Grant King has not flagged that he will lift electricity prices that Origin Energy charges customers. 

The technology giant Google uses very little debt in its funding mix and certainly cannot draw on funding from government guaranteed customer deposits.  Despite this, it doesn’t charge users for an array of incredibly useful and valuable services.  Sure, the company benefits from a network effect of attracting a critical mass of users to its services and to that end, offer such services for free or well below marginal cost.  Nonetheless, to my knowledge, outside of the banking sector, CEOs do not propagate a narrative linking their capital structure to prices they charge customers for their products and services.

So Mr Hartzer, why are you seeking to confuse politicians, policymakers and the public by linking the composition of Westpac’s liabilities with the assets or loans that the company writes?  Of course, citing the lift in mortgage risk weights for higher variable home loan rates helps to deflect blame to the prudential regulator.  It might even encourage other major banks to lift their home loan rates and adopt a similar approach in managing their own reputational risk by shifting the onus to APRA.

Nonetheless, I believe that Westpac will need to carefully manage the longer term brand damage if it continues to link further movements in lending rates to the amount of loss absorbing capital in its capital structure.

What’s capital structure got to do with it?

Finally, a number of media reports have suggested that despite APRA's additional capital requirements, Westpac has maintained its target ROE of 15%.  To the extent that these media reports are accurate, their thrust is inconsistent with Miller and Modigliani’s Irrelevance Theorem; that a firm’s capital structure doesn’t matter for firm value.  Increases in leverage leave the weighted average cost of capital unchanged because the expected cost of equity rises, commensurate with the company’s higher risk profile.  Conversely, lower leverage is associated with a lower expected cost of equity, other things being equal.

So the additional loss absorbing capital in Westpac’s capital structure should lower its expected ROE by making the bank safer and more resilient.  The chart below confirms that the largest global banks which are heavily dependent on equity finance in their capital structure tend to have lower volatility of stock returns.

WI-20151019-GlobalBanks1.jpg

Weekly Impressions: org | anz | WOW

The two key company announcements in Australia in the past week were Origin Energy’s launch of a $2.5 billion entitlement offer designed to strengthen its balance sheet and CEO succession at ANZ, with Mr Mike Smith stepping down after eight years in the role.

Origin Energy (ORG) shores up its balance sheet

In addition to the $2.5 billion entitlement offer, ORG announced that it would adopt a number of other measures to shore up its balance sheet, including cutting dividend guidance, selling non-core assets, and reducing capital expenditure and working capital requirements.

This has occurred against the backdrop of a lift in the company’s ratio of total debt to equity to over 90%, its highest level in a decade (see chart).  If the proceeds from the 4 for 7 rights issue are used to pay down debt –as the company has announced – the gearing ratio will decline to below 70%.  ORG announced on Friday that there had been 92% take up by eligible institutional investors at the $4.00 offer price.

The weight of the academic literature shows that firms undertaking seasoned equity raisings tend to under-perform because company insiders are more likely to issue equity – to finance acquisitions and investment projects - when they believe that their scrip is overpriced.  But the international evidence is more supportive of capital raisings that are designed to strengthen a company’s balance sheet.  In fact, many of the capital raisings in Australia through 2008 and 2009 in the wake of the financial crisis, were associated with subsequent out-performance as investors assigned lower default risk to many of these firms.

The balance sheet impact of lower capex and working capital requirements – up to $1 billion across FY16 and F17 should not be under-estimated.  ORG’s capex spend in FY15 was $1.7 billion, so the planned cut would amount to a 30% reduction in each of the next two years (see chart).  Much will hinge on the outlook for oil prices, but the measures to streamline the asset side of the balance sheet and lift the equity component of the company's liabilities should re-position the company in the event that oil prices remain at current levels.  But it also gives shareholders greater participation in the upside if the outlook for oil prices improves.

Sizing up Mr Smith's footprint

Mr Mike Smith announced that he would be stepping down as ANZ's CEO after eight years in the role.  Much of the media commentary has focussed on the bank's Asian footprint as his legacy.  Has the strategy to expand into banking markets more competitive than Australia to get exposure to the region's rising middle classes been a sound one? 

The company's growth prospects relative to other banks represents a good starting point.  Analysts' forecasts for ANZ's EPS are 20% higher now than when Mr Smith commenced in his role in 2007.  Although this is well above the NAB's performance, it is substantially lower than CBA and slightly lower than WBC (see chart).

WI1004-bankEPS.jpg

 Analysts downgraded the bank's growth prospects more aggressively than WBC and CBA during the financial crisis, and never fully recovered.  In fairness to Mr Smith, ANZ's business exposure - already a feature of the bank's loan book prior to his tenure - largely contributed to the significant downgrade to the company's growth prospects during this time.  The chart below shows that the spike in the sector's non-performing assets during the financial crisis was larger for business loans than for either personal or housing loans.

The fact that the company's price to book ratio remains comparable to NAB's - as it was at the start of the Mr Smith's tenure as ANZ CEO - but worsened relative to WBC and CBA's book multiple confirms that Mr Smith's strategy has not improved the bank's growth prospects relative to its key peers (see chart). 

The difficulty with sizing up Mr Smith's footprint is not knowing the counterfactual; that is, what strategy would Mr Smith have pursued if he had not sought to expand ANZ's Asian footprint?  With the benefit of hindsight, the rapid growth of housing credit - particularly for investors - suggests that ANZ might have benefited from gaining market share from WBC and CBA  in this space and reducing its reliance on business lending, which has remained anaemic.  But this approach could have led to a price war, which would have been detrimental to sector wide profitability and attracted the attention of APRA and the RBA. 

Woolworths: The quest to combat poor value for money perception

The senior management ranks at Woolworths remain in a state of flux, while its CEO succession 'planning'  drags on; it has been over three months since Mr Grant O'Brien announced he would be stepping down.

WOW has been much criticised across a number of fronts, including its willingness to maintain and expand already fat profit margins at the expense of delivering value to the customer, at a time when Coles and Aldi have been competing aggressively on price.

WOW has started to embark on its quest to neutralise its perceived poor value for money. On a recent visit to the local Woolies supermarket, Evidente noticed that staff had put a trolley at the store entrance, with a price comparison that showed that the items in the trolley were 20% cheaper now than at the start of the year. The trolley also drew attention to the fact that prices had dropped on over a thousand products, presumably over the same period (see photo).  Evidente will shortly be releasing a research report, reviewing the investment case made for WOW earlier this year.


Weekly Impressions - Australia's policital culture at a cross-roads

The decision by the Coalition government to replace its leader, Tony Abbott, with Malcolm Turnbull dominated developments in Australia in the past week.  Much of the commentary has drawn parallels with similar machinations in the previous government, in which Julia Gillard replaced Kevin Rudd in his first term as Prime Minister.  Much has also been made of the renewed instability of Australian politics, which has seen five Prime Ministers in as many years.

Many political commentators have discussed the different style in communication that Mr Turnbull will bring to his Prime Ministership.  Indeed, Mr Turnbull himself has flagged that the Government will need to do a better job in articulating an economic vision for Australia.  Whatever that vision is – which he is yet to articulate – Evidente’s view is that four key factors will constrain the new Prime Minister’s ability to execute on that vision: the stark reality of the Senate, Australia’s terms of trade shock associated with China’s slowdown, the country’s wage recession, and the wedge between government revenue and spending.

The Senate’s stark reality

Australia’s Senate or Upper House of Parliament is composed of 76 seats; 12 from each of the six states and two from the two territories.  Most Bills are initiated in the House of Representatives or the Lower House, but need to be passed in the Senate.

The Coalition Government (composed of the Liberal and National parties) falls well short of the 39 seat majority required.  At present, the Coalition holds 33 seats, followed by the Australian Labor Party (ALP) with 25 seats and the Greens with 10 seats.  The remaining 11 seats are held by various independents and small minority parties (see exhibit).

In recent decades, it has been common for the Government of the day – which holds the majority in the House of Representatives – to rely on other parties to achieve a majority in the Senate.  But the Senate has become more hostile in recent times, with the emergence of the Greens as the third force in Australian politics, effectively displacing the Australian Democrats, which had been a centrist party.  The Greens’ left wing origins mean that it more commonly votes with the ALP, so that the Coalition must rely on the support of a disparate group of mainly populist independent and fringe parties.

The Abbott Government discovered the Senate's hostility when it failed to garner support in the Upper House for two key items in its first Budget in 2014: the Medicare co-payment of $7 for a visit to the doctor and the deregulation of higher education, both important reforms designed in part to address the growing budget deficit.  The great expectations that Canberra’s press gallery and the community have for the Turnbull Government are unlikely to be met thanks to the stark reality of the Senate.

Australia’s wage recession

Australia’s wage cost index is only 2.3% higher than a year ago, which represents its slowest annual growth since the inception of the series in the late 1990s and well below growth at the peak of the financial crisis (see chart).  The wage recession suggests that the demand for labour remains weak.  Renewed strength of employment growth in recent months might be an early sign that low wages growth is encouraging businesses to lift their hiring intentions.

Sluggish wages growth might help to explain the adverse community reaction to the travel rorts affair recently, which claimed the scalp of the Speaker of the House of Representatives, Ms Bronwyn Bishop.  From the perspective of the new Turnbull Government, the community’s appetite for economic reform will remain limited thanks to Australia’s wage recession.

Let’s not talk about the elephant in the room

The former Treasury Secretary, Mr Martin Parkinson, has been vocal for some time about the conversation that politicians have not had the courage to have with the community around the divergence between government revenues and expenditures.  After growing in line with government outlays during the credit boom, tax revenue dropped sharply during the financial crisis and although it has recovered since then, it hasn't kept up with the path of government spending (see chart).

At the coal-face, social reforms such as the National Disability Insurance Scheme (NDIS) have received bipartisan support, but there has been little public debate about how the costly scheme will be funded.

The Turnbull government faces a delicate task between not further undermining already fragile consumer and business confidence in the short-term, but putting its financial position on a sustainable footing over the medium term by addressing the growing wedge between government revenues and expenditures.  At a time when wages are growing at a record low, perhaps the community is not ready to have this conversation just yet.

The terms of trade shock

Like the Abbott and Gillard Governments, the economic fortunes of the Turnbull Government will be hostage to China’s future growth prospects and Australia’s terms of trade – the price it receives for its exports relative to the price it pays for its imports.  Growth in China’s industrial production and fixed asset investment has continued to moderate in the past year, while annual retail sales growth has remained at 10% for the past four years (see chart). 

WI0919-China.jpg

Against this backdrop, Australia’s terms of trade has declined by 30% from its peak in 2011, which has been an important drag on growth in nominal GDP.  Despite this, the terms of trade remains well above historical norms (see chart). 

Importantly, there are renewed concerns about the authorities' ability and willingness to stimulate the economy, re-balance growth from investment to consumption, and undertake necessary reforms to State Owned Enterprises.  Further weakness in markets for Australia’s key export commodities – iron ore and coal – will undermine the Turnbull Government’s capacity to undertake budget repair.

Weekly Impressions

The key company announcement during the week in Australia came from Woodside Petroleum, that it had provided Oil Search a confidential and non-binding proposal to merge through a scheme of arrangement.  Under the proposal, Oil Search shareholders would receive all scrip consideration of 0.25 Woodside shares for every Oil Search share and become shareholders in the combined entity.  Discussions between the two companies are still at a preliminary stage.

The preliminary offer valued OSH at a 13% premium to their price immediately prior to the announcement.  OSH’s main asset is its 29% interest in the PNG LNG Project, a liquefied natural gas (LNG) development operated by ExxonMobil PNG Limited.

I recommend that investors avoid Woodside for four reasons. 

  • Mergers & Acquisitions 101 says that acquirers that make all scrip bids perform poorly on average.  This might reflect the fact that insiders engage in market timing; issuing capital to fund expansion or acquisitions when they believe that their scrip is expensive.  Woodside’s share price has fallen by around 30% in the past year, so it is unlikely that its insiders believe that it is timely to use their scrip as currency.  But immediately prior to Woodside’s announcement, Oil Search had fallen by 25% over the past year, so in their wisdom, Woodside’s insiders clearly believe that their target asset now represents a bargain.
  • Investors however are yet to be convinced of the rationale for the proposed deal.  The combined market value of the two companies is 2% lower than immediately prior to the announcement.  Woodside clearly needs to do more to convince investors of the synergies that it can extract from managing Oil Search’s assets.
  • If the synergies between the two companies are thought to be limited, investors will be sceptical of any purported diversification benefits, particularly in an era of renewed corporate focus.  The company already ranks close to the top quartile of ASX200 companies based on Evidente’s proprietary score of agency costs (see table).  The complexity of the firm will only increase if the deal proceeds thanks to the size of Oil Search.  Moreover, management will be distracted trying to integrate the two businesses. 
  • Woodside ranks in the bottom quartile of ASX200 companies based on earnings revisions (see table).
WI0912-AgencyCosts.jpg

The key macro data points for Australia were the modest fall in the unemployment rate to 6.2% in August and 5% decline in consumer sentiment.  At present, this is little cause for alarm; the 3 month moving average of consumer sentiment has been at or below current levels three times in the past four years.  Each episode proved to be temporary (see chart).  The renewed volatility in financial markets has likely impacted on the short-term psychology of the household sector.

The renewed weakness of consumer sentiment in recent months and associated poor performance of listed discretionary retailers during this time has challenged my positive view on the sector.  Despite weak growth in household disposable incomes, there are a number of macro tailwinds that should benefit the sector. 

  • The household savings ratio remains high, comparable to levels that prevailed in the late 1980s.  There is scope for households to become a little less prudent, and consume more out of their current income.  
  • Retail spending on household goods and clothing, footwear & personal accessories continues to trend up (see chart).  Department store sales are the only discretionary retail category that has flat-lined in recent years due to structural challenges facing those business models. 
  • But even sales at Myer and David Jones should benefit from a third macro tailwind; the renewed depreciation of the Australian dollar.  The lower dollar makes it more expensive for retailers to import items, particularly those that are paid for in US dollars.  But the competitive effects are likely to be powerful.  The lower dollar will lift the likelihood that a number of global department store retailers - some of which entered Australia at a time when the Australian dollar was closer to parity with the US dollar - do not further expand their presence in Australia, and even exit the country altogether.  Moreover, the lower dollar discourages the migration to online purchases.
  • Consumer spending and psychology is expected to benefit from further monetary stimulus as the RBA seeks to support consumption and dwelling investment at a time when the economy is on the precipice of a capex cliff.

There were two noteworthy communications from the RBA during the week, from Mr Philip Lowe (Deputy Governor) and Ms Luci Ellis (Head of Financial Stability). 

  • Mr Lowe highlighted that although the declines in the China's stock markets would have a limited impact on the country's growth prospects, the elevated volatility and authorities' attempts to restore stability had drawn attention to four key structural challenges facing China: the necessary shift from capital investment to consumption; liberalisation of markets for the key inputs of production including labour, capital and energy; demographics of ageing; and the strains and distortions of a still heavily regulated financial system.
  • Ms Ellis highlighted the importance of residential and commercial property in Australian bank lending.  The two account for over two-thirds of banking lending in Australia, much lower than in the United States (see chart).  Despite the importance of residential mortgages on Australian banks' balance sheets, during the crisis, non-performing assets rose sharply for commercial property and business lending.  These are now comparable to levels that prevailed prior to the crisis (see chart).

Weekly Impressions

The 173k lift in non-farm payrolls in the month of August fell modestly short of consensus expectations but confirms that the labour market in the United States continues to strengthen. The unemployment rate edged down to 5.1%, its lowest level in over seven years.

Despite these encouraging trends, growth in the US economy has stalled. In the past five years, nominal GDP has expanded at an average annual rate of 3-4%. Disinflationary forces have intensified in the past three years; core PCE inflation has trended down to sub-1.5% yoy at a time when the unemployment rate has declined by 300 basis points.

In prior posts, I have suggested that a flattening of the slope of the Phillips curve since the financial crisis can help to explain the positive correlation between US inflation and unemployment. With inflation expectations well anchored, inflation has become far less responsive to changes in the unemployment rate (and other measures of economic slack more broadly). The unemployment rate might have also become a less reliable barometer of labour market conditions because an ageing workforce has contributed to a structurally lower participation rate.

Despite this, the Federal Reserve has clearly interpreted the decline in the unemployment rate as a signal that the labour market is approaching full employment. But the disinflation of the past three years has challenged the conventional view of what constitutes full employment (see chart).


At the annual Jackson Hole symposium, Vice Chairman Stanley Fischer attributed the disinflation to three factors: US dollar appreciation, fall in commodity prices and stable inflation expectations.  He suggested that some of these factors are temporary and would be expected to diminish over time.  Mr Fischer said that the Fed would likely need to proceed cautiously in normalising the stance of monetary policy (read: don't expect rapid fire rate hikes) but in a clear signal that lift-off is imminent, added that the Fed should not wait until inflation is back to 2% before tightening given the long and variable lags associated with the operation of monetary policy.

At a time when core inflation is undershooting the Fed's target by over 50 basis points, no wonder market participants remain unnerved and puzzled by the Fed's determination to tighten policy and its blatant disregard for its inflation target.  It is too complacent that inflation will naturally return to 2% and I suspect is being distracted by concerns that an extended period of near zero interest rates will undermine financial stability. 

The proximity of the crisis suggests that the Fed is justified in being concerned about financial stability.  But more targeted macro-prudential policies designed to reduce the size and influence of the shadow banking sector, and lift the amount of equity finance on the balance sheets of financial institutions would do far more to reduce systemic risk of the financial system.

A tale of two central banks

The difference in language and communications between the US Federal Reserve and the ECB is striking.  During the week, ECB President, Mr Mario Draghi, highlighted that the outlook had weakened and re-iterated the central bank's willingness to use all the instruments within its mandate, and that the asset purchase program provides sufficient flexibility in terms of adjusting the size, composition and duration of the program.  He added that the current schedule of monthly purchases of 60 billion euros is intended to run until the end of September 2016 or beyond if necessary until there is a sustained adjustment in the path of inflation towards 2% over the medium term. 

The open ended nature of the ECB's large scale asset purchases (LSAP) suggests that unlike the US Federal Reserve, the ECB does not take for granted that inflation will naturally return back towards 2%.  Since the current program of LSAP was announced in early 2015, it has been associated with the end of the three year long disinflation (see chart above).  The more aggressive approach by the ECB relative to the US Fed probably stems in part from the lesson learnt from a policy error in 2011, when the ECB lifted its official interest rate twice - at a time when the core Harmonised Index of Consumer Prices (HICP) was running at only 1.5% yoy - only to retreat soon after (see chart below).


A policy error in real time

 The key risk to the global economy is that the US Federal Reserve is committing a policy error by contemplating a policy tightening at a time when the economy is suffering from an extended disinflation and at a time when inflation continues to undershoot the central bank's target by a long way. 

Investment strategy: Overweight Euro Stoxx; Underweight S&P500

Against this backdrop, I recommend investors move overweight the Euro Stoxx index.  The chart below shows that analysts have been modestly lifting their growth outlook for the Euro Stoxx index this year, coinciding with the ECB's more aggressive monetary stimulus.  At around 14x, the market is not cheap but will remain expensive as investors continue to price in a recovery in earnings and gain more confidence that the ECB is determined to address the euro zone's shortfall in aggregate demand.

I recommend that investors fund the overweight position by having underweight in the S&P500 index.  The chart below shows that in the past year, around the time that the Fed started to communicate to market participants its intention to end its zero interest rate policy, analysts' expectations of growth have stagnated after a five year long period of upgrades.  US dollar appreciation - associated with expectations of rate hikes - has clearly crimped the US dollar earnings of offshore earners.


RBA's patience continues to wear thin

The June quarter National Accounts confirmed that growth in Australia remains tepid.  Real GDP expanded at rate of 2% yoy, with the key contributions coming from consumption, dwelling investment and net exports, while inventories and private business investment provided significant drags (see chart).  I noted in last week's post that despite the weakness in business investment already evident in the past year, the economy is on the precipice of a capex cliff over the 2015/16 financial year, in the order of 20% or $30 billion. 

The renewed depreciation of the Australian dollar will help to further lift the competitiveness of exporters and boost the contribution to growth from net exports.  But as long as the much anticipated transition from mining to non-mining capex remains elusive, the RBA has little choice but to ease policy further to ensure that consumption and dwelling investment continue to support the outlook.

The tepid state of growth in the Australia's economy owes much to the terms of trade shock, which have fallen by over 50% since global commodity prices peaked in 2011, and the RBA's caution in easing policy during this period.  Despite the magnitude of the terms of trade shock, the Overnight Cash Rate of 2% remains well above official interest rates in most other advanced economies. 

Against this backdrop, EPS growth prospects have stagnated for five years now and the consensus 12 month forward EPS estimate remains 25% below its pre-crisis peak (see chart).  Thus, the ASX200 has been hostage to periods of multiple contraction and expansion.  At current levels, the PE of around 14x is broadly in line with historical norms by the standards of the past decade.

A dividend discount model for the market tells a very different story.  The price to dividend ratio has remained broadly steady over the past five years, but a 25% lift in analysts' dividend forecasts have underpinned the rise in the ASX200 over this period (see chart). 

The recent market volatility has seen the P/D ratio decline to around 21x.  Rather than representing a buying opportunity, in my view the lower P/D ratio suggests that market participants are becoming more sceptical of the ability for the ASX200 companies to lift dividends at the same rate as the past five years have shown.  Indeed, the chart below shows that the rate of analysts' dividend upgrades have slowed over the past year.

WI0906-pd.jpg

Weekly Impressions

The 5½% drop in the S&P500 in August was the biggest monthly fall since mid-2012, while the ASX200 declined by 7½%, its biggest fall since mid-2010.  Annualised volatility in the S&P500 spiked to 27%, its highest level since November 2011.  Nonetheless, the 6 month moving average of volatility of 14% remains broadly in line with historical trends over the sweep of the past 45 years (see chart).

Positive surprise on 2Q GDP, but growth remains stalled

The data flow from the United States was surprisingly upbeat.  The second estimate for real GDP showed a 3.7% (annualised) lift in the June quarter, up from the advance estimate of 2.3% and well above the March quarter outcome of 0.6%.  This lifted average annual growth in nominal GDP (the current value of GDP) to 4% in 2014/15.  But nominal GDP growth has stalled for the past five years at 3-4%pa (see chart).

The growth stall might help to explain why animal spirits in the corporate sector have remained dormant because nominal GDP is a more robust guide to business and consumer sentiment than real GDP.  After all, businesses and households do not earn inflation adjusted cash flows.

The US Federal Reserve’s unwillingness to combat disinflationary forces has contributed to the growth stall.  The core personal & consumption expenditure (PCE) price index (which excludes food & energy items) is only 1.3% higher than its level a year ago.  No doubt, the Fed remains puzzled that the disinflation of the past four years has emerged at a time when the unemployment rate has declined by more than 300 basis points (see chart).  So much for a ‘tighter’ labour market contributing to higher inflation.

The apparent breakdown in the traditional inverse relationship between unemployment and inflation has been reflected in a flattening of the Phillips curve since the financial crisis, confirming that core inflation has become less responsive to changes in the unemployment rate (see chart).  The flatter slope reflects 1) the fact that the unemployment rate has become a less reliable barometer for labour market conditions due to structurally lower labour force participation; and 2) inflation expectations remain well anchored.

Evidente has previously suggested that the flatter Phillips curve means that further cyclical improvement in the labour market might not lead to inflation moving back towards the Federal Reserve's 2% objective, giving the central bank scope to remain patient in it approach to normalising monetary policy (see blog post from 6th April 2015).  But it appears that the Yellen Fed’s patience with its zero interest rate policy (ZIRP) is wearing thin, with the Fed flagging an imminent start to the normalisation of the Federal Funds rate.


Market volatility to remain high until the Fed clearly enunciates its goal

I and many others remain puzzled by the Yellen Fed’s approach because it is not clear what the Fed is seeking to achieve.  Investors continue to be unnerved by the Fed’s willingness to tighten monetary policy at a time when inflation continues to undershoot its 2% target. US breakeven (TIPS implied) inflation expectations have fallen to 1.6%, their lowest level since 2010, wages growth is running at 2%pa and as cited above, core PCE inflation is running at below 1.5%pa.  Financial market volatility will remain high until the Federal Reserve more clearly enunciates the goals of monetary policy and why it remains indifferent to achieving its inflation target

Australia's capex cliff to keep pressure on the RBA to ease policy again

In Australia, the poor June quarter capex survey went under the radar due to the reporting season and elevated market volatility.  The survey represents unambiguously bad news for the outlook, confirming that the economy is on the precipice of a $30 billion capex cliff, which would amount to a 20% slump (see chart).  The long and drawn out transition from mining to non-mining capex continues to weigh on growth and frustrate the RBA.  In my view, the re-balancing of growth will need an assist from further monetary stimulus

Woolworths – New hierarchy will need to re-focus on supermarkets

As far as reporting season, there were few big earnings surprises amongst the big cap stocks during the week.  The news flow focussed on the drop in after tax net profit for Woolworths and the announcement of Mr Gordon Cairns as new Chairman.  Masters continues to bleed money, and results at discount retail chain BIG W remain disappointing.  The first step for Mr Cairns will be to find a replacement for outgoing CEO Mr Grant O’Brien. And the first step for the new CEO should be to divest the Masters and BIG W businesses, and re-focus Woolworths on its core competitive advantage of supermarkets where margins remain under pressure.

Postscript: After I had completed this post, Vice Chairman Stanley Fischer spoke at the annual Jackson Hole symposium, and attributed the low inflation in the United States in recent years to: US dollar appreciation, fall in commodity prices and stable inflation expectations.  He said that the Fed would likely need to proceed cautiously in normalising the stance of monetary policy (read: don't expect rapid fire rate hikes) but in a clear signal that lift-off is imminent, added that the Fed should not wait until inflation is back to 2% before tightening.  These comments will only add to the market's confusion regarding the Fed's indifference to its inflation target. 


Weekly Impressions

In another turbulent week for global stock markets, the S&P500 moved sharply lower overnight, shedding over 3%, apparently on continued concerns about China's future growth prospects following the weaker than expected manufacturing survey mid-week and renewed volatility in the Shanghai Composite Index.

The key question for investors is whether US stocks at current levels, represent good value now.  Despite the correction in recent months, the stock market still doesn't look particularly cheap, with the 12 month forward PE on the S&P500 of 15.7x still higher than historical norms (see chart).  The headwinds facing US stock investors stem from the stagnation in expected profitability over the past 12 months.  This follows a rapid recovery in profitability from 2009 to 2011, followed by more modest upgrades from 2011 to mid-2014.  Since then, growth prospects have remained broadly unchanged, in part reflecting the appreciation of the US dollar.  An effective tightening of monetary policy - thanks to the end of QE and imminent end to the Fed's policy of forward guidance - probably has been another headwind facing corporate America. 

The ASX200 fell by around 5% during the week to its lowest level since December 2014.  The start of the year now seems a very long time ago, when synchronised monetary easings by over 20 central banks - including the RBA - over the course of a month - helped to propel stocks higher.  Analysts have marginally downgrade future growth prospects for the ASX200 companies in aggregate year to date, which means that the 12 month forward PE of 14.5x is little changed from the end of 2014 and in line with historical norms.

Future growth prospects of the ASX200 have now stagnated for almost five years, so episodes of multiple expansion and contraction have driven market volatility over this time.  Since mid-2013, the 12 month forward PE has hovered in a narrow range of 13x to 16x, so the current PE is at the mid-point of the range, making the market look neither cheap or expensive at current levels (see chart).

Beyond the cycles of multiple expansion and contraction, a pick-up in earnings growth is the necessary ingredient to drive the market sustainable higher.  But while the Australian economy remains stuck in a nominal funk, revenue headwinds will remain persistent.  Margin expansion can only drive profitability so far.  Since global commodity prices peaked in mid-2011, growth in nominal GDP has been even more anaemic than the early recession of the early 1990s.  In previous posts, I have suggested - contrary to conventional wisdom - that the RBA has been too slow to respond the negative terms of trade shock, which have declined by over 50% from the peak.  The central bank has been more concerned about the composition of growth - hoping that net exports and non-mining capital spending would drive growth - than overall growth in nominal GDP. 

Evidente has also previously highlighted that the five year long stagnation in growth prospects for the ASX200 is testimony to the resilience of corporate Australia, considering the stiff revenue headwinds that companies have faced.  Companies have trimmed costs aggressively, undertaken restructuring, sold off underperforming and non-core assets, and deferred capex where feasible.  Some analysts have taken a glass half empty view of the weakness in business investment, interpreting this as evidence of under-investment in future growth.  But most investors have rightly taken a glass half full perspective, and ascribed tremendous value to companies that have foregone investment opportunities that do not meet their cost of capital requirements, and returned capital to shareholders, predominantly in the form of higher dividends.

At a time when the terms of trade has shed 50% and future earnings growth prospects have stagnated, it is remarkable that analysts' dividend forecasts are one third higher than five years ago (see chart).

At the stock level, even small earnings misses continue to be punished by the market, notably Seek and Dick Smith Holdings.  Given the stellar rise of Seek over the past decade as the dominant online platform for job ads, the 10% fall on the result garnered plenty of news flow, namely comments from the CEO that investors remain subject to short termism, and exhibit little patience for Seek's plans for global expansion.  There might well be an element of truth, but Seek is not being singled out by investors.  After all, the equity risk premium has increased in recent years, as investors have lost trust in CEOs to undertake value accretive investments and acquisitions.  But the adverse reaction to SEK's results reflects the fact that analysts' growth expectations had become excessively optimistic.  Not only did analysts' earnings upgrades for the stock start to slow in early 2015, but have started to downgrade the company's growth prospects in recent months (see chart). 

Other high growth stocks that have been subject to growth stalls or downgrades in recent months include REA and Carsales (see chart).  Domino's Pizza has bucked the trend, with analysts continuing to upgrade the company's future growth strongly in the past year.

For high growth stocks trading on rich multiples, even small earnings misses can lead investors to re-assess the company's longer term growth prospects.  Consequently, investors have de-rated SEK, REA and CAR (see chart).  Given the top-down headwinds that have buffeted corporate Australia cited above, the aggregate supply of growth has been scarce over the past five years.  In hindsight, those few stocks that offered strong growth prospects were strongly bid up by investors.  For Domino's, the risk it that its strong growth profile has become even more scarce in an environment where the growth prospects of other market darlings have stalled.

Weekly Impressions

The 5% devaluation of China's currency dominated financial markets in this past week.  The China bears seem to garner most of the headlines these days, and so it was again: according to the pessimists, the devaluation confirms that the economy is in dire straits and that the government is desperate to boost net exports and so ameliorate the ongoing weakness in consumption and business investment.  To many commentators, China's devaluation represents the latest chapter in the ongoing saga of 'currency wars' waged amongst the world's central banks.

Devaluation yes, but after many years of appreciation

What seems to have gone under the radar in much of the press and commentary is that the Chinese Yuan (CNY) has undergone a significant appreciation in recent years.  Because it has been broadly pegged to the US dollar, the CNY effectively had appreciated by 25% against a basket of its major trading partners.  As a result, the devaluation only returns the CNY's trade weighted index back to levels that prevailed as recently as November 2014 (see chart). 

The bears are right to argue that the devaluation is a signal that the authorities remain concerned about China's future growth prospects. But they have good reason to: manufacturing and industrial production remain in a funk, disinflation is widespread (with pockets of deflation), the recent sharp fall in Chinese stocks has rattled confidence, and many residential and commercial property markets are suffering from a glut of inventory.  Against the backdrop of a weakening economy in recent years, the CNY would likely have depreciated if it had been a floating currency.  The PBOC has not put up the white flag; it is right to seek to re-align the currency with the economy's fundamentals.

In fact, the devaluation of the CNY - together with the recent relaxation of reserve requirements, cut to official interest rates, and (at times clumsy) efforts to support the stock market - has brought the PBOC in line with other central banks, that have eased monetary policies which has been designed to address the global shortfall in aggregate demand.  When the ECB and BOJ adopted more aggressive monetary stimulus at various stages in the past year, financial markets welcomed those moves. 

Yet the PBOC is derided as irresponsible when it seeks to also address the classic symptoms of a domestic cyclical downturn.  This is not to deny China's many structural challenges, including much needed reform of the financial system and re-balancing of growth towards consumption.  Such structural reforms are necessary to help China achieve sustainable growth over the medium term.  But China - along with most other economies - is currently suffering from deficient demand and the best solution is more aggressive monetary stimulus.

Record low wage growth in Australia a signal that labour demand remains weak

In Australia, the clearest sign of an economy that is also suffering from a shortfall in aggregate demand was continued absence of wage pressures.  The private sector wage rate (excluding bonuses) is 2.2% higher than a year ago, which represents the slowest annual growth since the inception of the wage price index in the late 1990s (see chart).  In a speech delivered during the week, the RBA's Christopher Kent confirmed that record low wages growth reflects weak demand for labour, and this is consistent with animal spirits remaining dormant in the corporate sector.

The much anticipated handover from mining capex to non-mining capex remains elusive and continues to be a source of frustration to the RBA.  In another speech from the central bank delivered during the week, Mr Phillip Lowe acknowledged that while this transition continues to drag on, it is appropriate that the household saving rate decline further; that is, it is reasonable to expect consumption to grow faster than disposable income to support growth at time when the corporate sector was showing little appetite for taking on investment projects. 

As long as the 'economy is expected to operate with a degree of spare capacity for some time' (in the RBA's own words), institutional investors should have an overweight in some of the richly valued defensives that have strong earnings predictability.  Based on Evidente's proprietary earnings predictability scores, stocks that have ranked highly on this measure have outperformed significantly since 2011, coinciding with the peak in global commodity prices (see chart).  Other stocks that rank strongly on Evidente's earnings predictability measure include: ASX, Ramsey Healthcare, AGL, Amcor and Coca Cola Amatil.

Investors have now digested the major banks' capital raisings, but expect EPSg to revert to low single digits

At the sector level, banks continued to dominate the reporting season, with CBA being the last major to announce a capital raise (a rights issue of $5 billion).  Certainly significant considering that they reported a full year after tax net profit of $9 billion.  Encouragingly, the lift in bad & doubtful debts announced by ANZ in the prior week (citing renewed risks in agriculture and mining) does not seem to have been shared by either NAB or CBA. 

Given that the bad & doubtful debt cycle is likely to have troughed, EPS growth for the sector is likely to revert to low single digits, consistent with growth in nominal GDP.  This was reflected in CBA's growth of 5% in NPAT for the full year.  Balance sheets across corporate Australia in aggregate, remain in excellent shape.  But pockets of stress pose risks to the majors, particularly low and declining yields for commercial property, which continue to be characterised by rising vacancy rates, particularly in Perth and Brisbane. 

Upside to EPS growth is limited and the sector is trading on multiples that are at the high end of historical norms, suggesting limited scope for valuation expansion.  Nonetheless, I continue to recommend that investors have a small overweight position in the sector due to sustainably high payout ratios and strong predictability of earnings.  Higher capital requirements will dilute their ROEs but the banks have the flexibility to eke out more efficiency gains and drive their already low cost to income ratios even lower.  Stronger capital buffers will also help the banks to better cope with adverse exogenous shocks, such as renewed weakness in property markets.

Macro-prudential measures to curb credit growth to housing investors - Avoid REA

The ongoing strength in residential property markets in Sydney and Melbourne helped Realestate.com (REA) to report a 24% lift in NPAT for the full year.  The CEO's presentation slides highlighted the penetration of premium listing products, investment in high growth markets and boasted the size and engagement of its audience.  The CEO also devoted no less than three slides to that old chestnut, innovation.

But there was no mention of the two key macro drivers of the stock: turnover of the housing stock (which governs listings) and new lending commitments (the two are strongly correlated).   House lending has been on an upward trend for the past three years, lifting from 14% to 18% of the stock of housing credit, underpinned by lending to investors, while lending to owner-occupiers has stagnated (see chart). 

The key risk going forward is that lending to investors slows as the lift in investor lending rates and more stringent LVR restrictions take effect.  The RBA and APRA are clearly determined to engineer a moderation in credit growth to this segment to sub-10%.  Lending to owner-occupiers is likely to pick up the slack only if the majors loosen their LVR restrictions to this segment (unlikely) or the RBA eases policy again (likely, but not for a while).  In the meantime, expect growth in total lending commitments to slow and turnover in the housing stock to plateau or decline.  To achieve growth in listings in these conditions, REA will need to win market share from Domain, which could spark renewed price competition.  Investors should avoid REA while this dynamic plays out. 

Ansell: The dark side of global diversification

The earnings torpedo delivered by rubber glove and condom manufacturer Ansell last week highlights the dark side of global diversification.  Investors - who marked down the stock by 16% on the day of the result - clearly didn't believe the CEO, who cited adverse currency moves, currency hedging gone wrong and disappointing economic performances in many key developed and emerging markets.  The Chanticleer column in the Australian Financial Review wrote an excellent piece this week on the poor performance of a number of complex, multi-national businesses, with assets located in multiple jurisdictions, including Ansell, Orica, QBE and NAB.  The poor returns from ASX listed global conglomerates demonstrate just how difficult these businesses are to manage for Australian based CEOs. 

Evidente has updated its model of firm complexity, based on five factors, including product diversity and geographical dispersion.   According to the model, the most complex stocks include: Seek.com, Qantas, Worley Parsons, AMP and Computershare (Ansell ranks in the top quartile of complexity).  If history is any guide, the risk is that these stocks can invariably deliver earnings torpedos, particularly for those that have poor quality management and weak governance structures in place. 


Dear Banker, Please do not mess with Mr Stevens

During the reporting season, Evidente will be providing regular updates of the key themes emerging from company announcements, as well as communications from the government and central bank.

In a busy week for macro news flow, the RBA decided to leave its policy rate unchanged, as was widely expected. In the statement accompanying the decision and the recently released quarterly Statement of Monetary Policy, the RBA confirms that headwinds facing the outlook are likely to persist and that the economy is expected to operate with a degree of spare capacity for some time yet. 

Of course, those monitoring the macro data flow would know that the economy has been operating at well below full capacity for some time already.  The fact that underlying inflation remains at the bottom end of the RBA's target range of 2-3% (and is probably undershooting the target by a long way when upside measurement bias in the CPI is taken into account) and private sector wages are growing at their most sluggish rate since the late 1990s confirms that the economy continues to suffer from a shortfall in aggregate demand.

It should therefore come as little surprise that sectors offering a high earnings certainty and sustainably high payout ratios have delivered above market returns over the past three years.  Consequently, the infrastructure, healthcare, telecommunications and bank sectors are trading on high multiples by historical standards, despite low growth prospects (except for healthcare).

If Mr Stevens is correct that aggregate demand will continue to be deficient (which I think he is), from a portfolio construction perspective, there is little reason to be underweight these sectors despite their rich valuations.  

Of these sectors, the one that continues to polarise opinion amongst portfolio managers is the banks, particularly following the past week in which the sector has shed 7%.  But I expect the renewed price weakness following ANZ's capital raising to be short lived.  The release of APRA's discussion paper a month ago - suggesting that the majors should add around 200 basis points of CET1 capital from their June 2014 levels - was timely and the majors have been astute in being proactive in getting ahead of the curve. 

The pessimists argue that being forced to use more equity in their liability mix will dilute banks' ROEs and undermine their ability to maintain high payout ratios.  However, higher capital buffers reduce the risk profile of the banks, and previous work I have done shows that conservative capital structures encourage banks to have higher payout ratios (see chart below and Evidente's blog post from November 12th 2014). 

Without the ongoing tailwind of lower bad & doubtful debt charges, the strong out-performance of recent years is unlikely to continue.  But I recommend having a small overweight bet in the majors due to the sector's strong dividend sustainability and ability for the banks to surprise the market on cost control.  For those unconvinced, any further price weakness on the back of what I consider to be misplaced concerns about higher capital requirements should be viewed as a buying opportunity.

Global investors have largely missed out on the bank sector's outperformance of recent years, based on their view that Australia's major banks are trading on rich book multiples relative to their global peers.  But those high book multiples persist thanks to high risk adjusted ROEs.  Moreover, based on proprietary work, I estimate that the majors have managed to hold onto the market share gained from the shadow banking sector during the financial crisis.  In contrast, shadow banks in other countries have regained the market share they ceded in the crisis.

Don't mess with Mr Stevens

Indeed, two developments in the past week ought to provide a cautionary tale for investors in shadow banks listed on the ASX.  First, Westpac announced that they would no longer provide funding to payday lenders, including Cash Converters (CCV) and Money3 (MNY).  Second, the outgoing Suncorp CEO acknowledged that when he commenced his role in 2009, Mr Glenn Stevens told him in no uncertain terms how he expected Suncorp to behave (presumably in terms of lending practices and risk taking activities more broadly).

A key lesson stemming from the financial crisis was that prudential regulators need to more carefully monitor the size and activities of shadow banks.  In order to check growth in non-regulated financial institutions, the RBA and APRA are likely to put pressure on the major banks to limit their funding of shadow banks.  Those shadow banks will have little choice but to tap investors for additional equity capital.  This process could potentially end in tears for shareholders, particularly as the regulators are determined to ensure that the aggregate market share of shadow banks in Australia does not recover to pre-crisis levels.  Evidente will shortly be releasing a detailed report on the outlook for ASX listed shadow banks.

The less cautious consumer: Good news for discretionary retailers

The only domestic cyclical sector that I continue to recommend an overweight position in is discretionary retailers, due to their exposure to a less cautious consumer (see Evidente's blog post from May 29th 2015). 

The June retail trade release confirmed that low interest rates and the wealth effect from rising house values are encouraging households to lift spending, particularly in light of the 2.2% lift in spending on household goods.  The modest decline in department store sales suggests that this sector remains structurally challenged, with David Jones and Myers responding with the announcement of strategic and workplace changes designed to adapt their offering to evolving consumer tastes.  The renewed depreciation in the Australian dollar could be a godsend to Myers, as it might encourage some of the global department store chains which opened stores in Australia at a time when the Australian dollar was significantly higher - including Zara and H&M - to exit the country in due course. 

RIO - Don't throw the baby out with the bathwater

Finally, RIO's interim result was well received by the market.  I remain comfortable maintaining an overweight in the stock, despite the prospect of renewed weakness in iron ore prices (Evidente's research report on 10th July contains more detail: Iron ore - Don't throw the baby out with the bath water).  Previous episodes of stagnant commodity prices have been associated with strong market returns from RIO, suggesting that at present, the market continues to under-estimate the company's ability to control operating costs, reduce capex and lift dividends (see chart). 


Monetary policy no villain

There is a widespread view among financial market participants that attributes much of the world economy's ills to irresponsibly loose monetary policy.  Many central banks have reached their zero lower bound and been there for a while, and pursued unconventional policies such as quantitative easing and forward guidance, designed to kick-start the psychology of risk taking.  But the headwinds facing the global economy have been far stronger and persistent than many had anticipated.

The RBA has not had to resort to such measures and although the cash rate of 2% is anchored at multi-decade lows, it remains among the highest official interest rates across advanced economies.  The interbank futures market assigns a probability of less than 10% that the RBA will cut the cash rate at the August board meeting.  In recent communications, RBA Governor, Mr Glenn Stevens, has highlighted his view that financial conditions remain accommodative and that the central bank will continue to monitor the effects of interest rate cuts in February and May.

Mr Stevens has speculated recently that Australia's growth speed limit might have declined due to slower population growth and that this might have also contributed to the stability in the unemployment rate.  Estimating potential growth or the structural unemployment rate is a notoriously difficult exercise.  But with private sector wages growing at their slowest rate since the late 1990s and underlying inflation anchored in the bottom half of the RBA's target range of 2-3%, it is hard to mount a case that the economy is hitting up against its speed limit.  Indeed, Mr Stevens himself has previously observed that the economy could do with more demand growth.  It is therefore reasonable to expect that there ought to be an easing bias, even if the RBA has not formally adopted one since cutting interest rates in May. 

For institutional investors, the outlook for monetary policy in Australia is likely to remain a sideshow to other macro themes, notably what the spill-over effects will be of the turmoil in China's stock markets, and the prospect of a lift in the US Federal Funds rate.  Nonetheless, investors will continue to field questions from those concerned that low interest rates in Australia run the risk of stoking speculative bubble in residential property markets, in high yielding stocks and encourage firms to lift payout ratios, thus under-investing for future growth.

Some of these concerns remain largely misplaced.  First, low interest rates have led to a lift in dwelling investment, which has been desirable given the mining and energy sector CAPEX cliffs.  But supply side constraints in the major cities - thanks to onerous regulatory restrictions on new high-rise developments - have also contributed to higher prices.

Second, high yielding stocks haven't actually out-performed.  Low beta stocks - many of which have strong earnings predictability - have delivered strong returns and are trading on higher multiples than historical norms.  But this has less to do with low interest rates and more to do with the fact that the risk premium has increased, as investors remain reluctant to take on too much risk.

Third, the sweep of the past 25 years shows that there the aggregate payout ratio is well within historical norms, despite the RBA official cash rate being at its lowest level over this period.  In fact, the chart below highlights five periods in the past 25 years where the aggregate payout ratio has peaked at levels above the current rate of 75% (see chart).  In previous blog posts, I attribute the rise in the payout ratio since the financial crisis to a loss of trust in CEOs' abilities to undertake value accretive growth projects and acquisitions.  Moreover, in a world awash with excess capacity and suffering from deficient demand, what incentive do CEOs have to undertake large growth projects?

Interbank futures are right to not expect the RBA to cut interest rates at the August board meeting.  But if the economy is still suffering from a shortfall in aggregate demand by year end (my expectation) there will be a growing chorus for further monetary stimulus.  APRA seems to be doing a good job of jawboning the banks to continue to lift the amount of equity capital in their liability mix, thus giving the RBA more scope to ease policy without stoking a property bubble.  The jawboning and other macro-prudential measures adopted by APRA have already led to a lift in lending rates for housing investors across the major banks in the past month.


A salute to corporate Australia

Many global investors have eschewed Australian stocks from their portfolios for a while now.  The high Australian dollar, sensitivity to the slowdown in China's growth and the attendant decline in commodity prices, the fact that the major banks continue to trade on higher multiples than their global peers and growing concerns of a bubble in Australia's residential property markets (particularly Sydney and Melbourne) have conspired to keep cautious global investors on the sidelines.

But the resilience of Australia's corporate sector has confounded most global investors.  Aggregate profitability has not declined over the past five years, despite the significant macro headwinds that have curtailed top-line growth.  Let's not gloss over just how severe the terms of trade shock has been; not only is the RBA's Commodity Price Index one third lower than five years ago, but the value of the Australian dollar relative to the US dollar has declined by only 10% over this time (see chart). 

Corporate Australia has responded admirably by  trimming costs aggressively, restructuring, divesting under-performing assets that have been peripheral to their core focus, and deferring capital spending where feasible.  No sector has remained untouched, including banks, mining, energy, telcos and retailing. Of course, the macroeconomic consequences of this belt tightening has led to a shortfall in aggregate demand, but that's a problem for the RBA to address, not corporate Australia.

Various measures of Australia wide corporate profitability show that there has been little change over the past five years, including the National Accounts measure of Gross Operating Surplus or forecast EPS for the ASX200 companies.  Consequently, forecast EPS remains one-quarter lower than the pre-crisis peak and has significantly lagged forecast EPS for the S&P500 companies, which is 20% higher than its pre-crisis peak.  But US companies have not had to deal with a large terms of trade shock and the Federal Reserve has been more determined to stimulate growth than the RBA. 

Given that forecast EPS for the ASX200 has remained stagnant for the past five years, multiple expansion has driven the market higher, with the 12 month prospective PE lifting to 15x from 11.5x (see chart). 

A decomposition of forecast EPS shows that balance sheet growth has slowed, and that the profitability or ROE achieved on the net asset base has deteriorated to 12% (see chart).

On face value, the important role that multiple expansion has played in the past five years does not point to an optimistic outlook for stocks.  The PE ratio of 15x suggests that there is limited upside from further multiple expansion.  In other words, it appears that earnings expansion will need to drive the market higher going forward.

But when we turn our focus to dividends, the picture changes somewhat.  I am a firm believer that sector analysts over-estimate the control that a company's CEO has over a stock's performance because there are so many factors that shape a stock's returns that are beyond the CEO's control.  But there is one key variable that a CEO and CFO can control; payout policy.  Many companies have increasingly catered to investors' insatiable appetite for income in recent years by lifting payout ratios.

At a time when expected profitability has stagnated, forecast dividends have grown by over one-quarter in the past five years.  Consequently, the payout ratio for the ASX200 companies has lifted to a ten year high of 75% (see chart).  I believe that this forms an integral part of the quiet revolution in corporate governance, because companies disgorging cash to shareholders reduces the conflicts of interest that exist between shareholders and managers (see my post from last week). 

Some - including the RBA Governor - have bemoaned the absence of entrepreneurial risk taking among Australian companies and implored the corporate sector to invest for growth.  But at a time when the world economy is still awash with excess capacity and revenue conditions remain anaemic, why would companies invest in projects at or below their cost of capital?  Fortunately, the corporate sector has done the sensible thing and returned capital back to shareholders.

A focus on dividends helps to re-cast the market's rise in the past five years.  The 25% growth in expected dividends means that the aggregate DPS is now approaching the pre-crisis peak.  Compare this with forecast EPS, which remains 25% below its pre-crisis peak.  Indeed, dividend expansion has actually been the dominant driver of the higher market since the dividend multiple has remained broadly steady at around 20x (see chart).  In other words, the prospective dividend yield has hovered around 5%.

The key risk to the market in the near term therefore lies in bank sector dividends and the highly concentrated nature of dividends paid.  Dividend concentration has increased since 2007, with the top 10 dividend payers generating 60% of total dividends paid by ASX listed companies, up from 43% in 2007 (see chart).  As APRA continues to lift capital requirements, bankers will no doubt cry wolf that these measures will dilute their ROEs and reduce their ability to sustain current high payout ratios.  But in previous work I have published, I show that banks with more equity capital actually pay higher dividends because they are safer.  More generally, I believe that the aggregate payout ratio will continue to increase despite already being at a 10 year high of 75%, particularly as companies continue to find innovative ways to free up cash.

To more recent events - Good news for value stocks

Finally, in the past week, two stocks have bounced: Pacific Brands which revised its profit guidance higher, and Kathmandu, on that announcement that Briscoe, a NZ based retailer would be lodging a takeover offer.  In mid-June, I spoke to a number of portfolio managers about discretionary retailers and drew their attention to a chart for the stocks in their sector which plots their P/B ratios against their consensus ROE expectations.  At the time, there were three value traps that lay well below the regression line: KMD, PBG and MYR (see chart).

I have updated the chart (see below) and it is noteworthy that despite the fact that both KMD and PBG have re-rated since mid-June, they remain well below the line, suggesting that there could be more upside.  It also remains to be seen whether investors will now start to re-assess whether the risk-reward trade-off has improved for other stocks long considered to be value traps, notably MYR.  

A loss of trust and the Quiet Revolution in Corporate Governance

"Payouts to shareholders reduce the resources under manager's control, thereby reducing managers' power...Conflicts of interest between shareholders and managers are especially severe when the organisation generates substantial free cash flow.  The problem is how to motivate managers to disgorge the cash rather than invest it at or below the cost of capital... "

- Professor Michael Jensen, 1986, Agency costs of free cash flow, corporate finance and takeovers, American Economic Review

Commentators and analysts continue to be vocal critics of the insatiable appetite for income that investors have developed in recent years.  The argument goes that this trend has encouraged companies to return capital back to shareholders in the form of higher dividends and buy-backs, at the expense of investing for future growth.  Thus, companies are apparently foregoing valuable growth opportunities stemming from investors' short-termism.  Although record low interest rates has probably contributed to the 'reach for yield' in financial markets, this post argues that investors' loss of trust in CEOs' ability to undertake value accretive projects and acquisitions has had an important influence on corporate payout policies.  Moreover, the greater propensity for companies to return capital back to shareholders has been far more powerful in reducing the agency costs of free cash flow than the noise created by the bloated ESG industry.

Since the turn of the century, the finance industry has becoming increasingly noisy in extolling the virtues of good corporate governance thanks to a number of high profile governance failures, including (but not limited to) Enron, Parmalat, Tyco, WorldCom, Lehman Bros and closer to home, HIH Insurance.

Australian asset managers have led their world in their march to being good corporate citizens; the take up of the United Nations Principles of Responsible Investing is among the highest in the world.  The mainstreaming of environmental, governance and social factors (ESG) has meant that most active funds showcase their ability to incorporate ESG into their investment processes. 

Many ASX listed companies have catered to the greater investor appetite for good governance by appointing more independent board directors, lifting the level of disclosure in annual reports, adopting remuneration structures that are designed to align the interests of senior management and shareholders, establishing audit and remuneration committees, and separating the roles of chairperson and CEO.  CEOs are astute enough to give investors what they want, particularly if it involves a low cost, low effort box ticking exercise.  Little surprise then that there has been a pattern of inflation in governance scores over the past decade, but it is far from clear that the greater awareness of governance issues has properly addressed the classic agency conflict that arises from the separation of ownership and management of corporate assets. 

Despite the 'noisy' revolution in corporate governance (and ESG more generally), has the upheaval in governance practices led to improved company outcomes globally?  In their pioneering study published in 2003, Paul Gompers et al demonstrated a strong empirical link between governance and performance in the United States through the 1990s; stocks with strong shareholder rights strongly outperformed and had higher firm value, higher profits, stronger sales growth, lower capital expenditures and undertook fewer corporate acquisitions.  But a more recently published study in 2012 by Lucian Bebchuk et al shows that although well governed firms continued to exhibit superior operating performance from 2000-08, they did not outperform stocks with weak shareholder rights.  The authors attribute their finding to investor learning;  there was a greater awareness of, and attention paid to governance by investors, which meant that good governance was already impounded into stock prices.

Anecdotal evidence also casts doubt on the link between good governance and stock returns; firms with weak shareholder rights and few independent board directors continue to deliver strong stock returns, including Apple, Newscorp, Westfield and Harvey Norman to name a few.

In his pioneering study from almost three decades ago, Michael Jensen argued that the separation of ownership and management of corporate assets gives rise to more severe agency conflicts when a company generates strong free cash flow, because there is scope for the CEO and senior executives to use the free cash flow to expand the size of the firm at the expense of profitability and shareholder returns.  Returning cash to shareholders therefore imposes a powerful discipline on the CEO, "...making it more likely they will incur the monitoring of the capital markets which occurs when the firm must obtain new capital."

Australian firms have for a while now had a higher dividend payout ratio than their global peers thanks to the adoption of the imputation system in 1987, which eliminates the double taxation of corporate profits that are paid out as dividends since shareholders receive an imputation credit for the tax already paid on profits by the company.  The aggregate payout ratio started to lift from the 1980s.

But more recently, companies have increasingly resorted to returning cash to shareholders in preference to re-investment and acquisitions.  For starters, dividend concentration has risen; the top 10 dividend payers in Australia generate  60% of aggregate dividends paid by All Ordinaries companies, well above the 43% generated at the peak of the credit boom in 2007 (see chart). 

Second, the aggregate payout ratio has lifted in recent years, to its current level of 70%, above the median of 65% since 1990 and well above historical trends over the past forty years (see chart).  The payout ratio has exhibited a strong cyclical pattern since the early 1990s, with sharp rises associated with either a contraction or stagnation in earnings, while the aggregate dividend per share has exhibited far less variability, confirming that companies engage in dividend smoothing.

The sustained lift in the payout ratio represents the flip-side of the corporate sector's dormant animal spirits.  The RBA Governor, Mr Glenn Stevens, has bemoaned the lack of risk taking in corporate Australia and implored businesses to invest for future growth.  But more recently, Mr Stevens and the RBA have acknowledged that the hurdle rates used by companies to evaluate future projects has remained sticky despite the fact that 10 year government bond yields remain close to record lows.

The financial crisis continues to cast a long shadow

I believe that the insatiable appetite for income that investors have developed has arisen in large part to a loss of trust in CEOs' ability and willingness to undertake value accretive projects and acquisitions.  The poor track record of acquisition led growth through the credit boom of the mid-2000s has left investors justifiably cynical of CEOs' motives: RIO, BHP and QBE are just some that come to mind that have undermined investors' confidence.

Marrying payout and predictability

I have developed a score for a company's payout ratio based on past dividends paid and stock buy-backs undertaken (see chart below).  I use total assets rather than EPS as the scaling variable due to the volatility and cyclicality of EPS for some companies.  Stocks that rank strongly across this metric include CSL, COH and CAR. 

Separately, I have developed a proprietary composite indicator for a stock's earnings predictability based on five variables.  The chart below plots the earnings predictability score against the aggregate payout ratio.  The plot identifies a number of stocks with potentially unsustainably high payout ratios because their predictability scores fall below the median, notably JBH and MND.  Three stocks that appear to have scope to lift their payout ratios due to their strong earnings predictability include: ASX, SGP and AGK. 

The other revolution in corporate governance

It is a welcome development that CEOs with a track record of acquisitive growth no longer command a premium in the market for managerial talent.  Boards increasingly are looking for CEO candidates that have a track record of prudence and cost control, and that exhibit a willingness to abandon under-performing assets that in the past might have been seen to represent future growth options, but are increasingly now viewed as peripheral and distracting from the company's core focus.  This 'other' revolution in corporate governance will be the subject of a forthcoming report from Evidente.


Woolworths - Risk Reward Becomes More Compelling

Last month, Evidente published an open letter to the Woolworths CEO, Grant O'Brien, suggesting that a lack of corporate focus had contributed to the company's poor recent performance.  The rollout of Masters stores since 2011 had been a significant drag on the group's performance, with the company having little choice but to push out the timing of break-even expectations from what in hindsight was an unrealistically aggressive timetable. 

The slowdown in sales growth of Australian Food & Liquor segment evident in the past year suggests that the expansion into home improvement has distracted management from its core supermarket business and taken up a disproportionate amount of management time and effort.  Woolworths has effectively bucked the recent trend towards corporate focus; the demerger wave of recent years amounts to corporate Australia waving the white flag on corporate diversification and acknowledging that focussed firms typically produce superior returns to their shareholders.

In an encouraging sign at the investor strategy day in early May, Mr O'Brien announced that Woolworths would re-allocate capital away from the under-performing Masters and Big W businesses towards supermarkets, including for store refurbishment.  Whether this represents a harbinger of an exit from these businesses remains to be seen.  In what amounted to a mea culpa, Mr O'Brien admitted that in seeking to preserve high margins, the supermarkets division had effectively sacrificed sales growth and customer loyalty, and flagged a shift in strategy designed to neutralise the community perception of Coles' price leadership.

Despite my ongoing concerns about the ability for the senior executives to effectively manage a number of disparate and under-performing businesses in the near term, particularly Big W and home improvement, the following set of charts suggest that at current levels, analysts and investors have become unduly pessimistic about the company's prospects. 

First, multiple contraction - rather than earnings contraction - has accounted for the lion's share of the stock's underperformance in the past year.  The 12mth forward earnings multiple has declined to 14x from 17.5x (see top panel of the chart below).  The bottom panel confirms that a continued deterioration of the company's incremental ROE coincided with the roll-out of the Masters stores which commenced in 2011, coinciding with the start of Mr O'Brien's tenure as CEO. 

Second, the stock is now trading at 14x 12mth forward earnings, which is a discount to the ASX200 (16x).  This represents the first time Woolworths has traded at a discount (see chart).

Third, Woolworths is trading at a discount to its global food & grocery peers based on profitability adjusted price to book ratios.  Valuation theory says that there ought to be a positive and linear relationship between a stock's expected ROE and its P/B ratio, and the positive regression line in the chart below confirms this.  After having traded typically at or above the regression line in recent years, Woolworths is now trading at a 10% discount based on this metric.

As analysts have downgraded its ROE outlook, the stock has undergone a material de-rating, particularly in the past year.  The chart below highlights the extent of the de-rating, and shows that if the stock's profitability adjusted P/B ratio was in line with its peers, it would be trading on a book multiple of 3.8x.

Fourth, when benchmarked against the stocks in the ASX100, Woolworths also offers compelling value.  Its profitability adjusted P/B ratio is more than 20% below the regression line (see chart).  A closer inspection of valuation theory suggests that this discount is unlikely to persist.  The perpetuity earnings discount model says that a stock's P/B ratio is equal to its future expected ROE multiplied by the reciprocal of k - g (expected stock return minus future expected growth in EPS).  The CAPM dictates that the only source of variation across stocks' expected returns is in a stock's beta; high beta stocks ought to trade at a discount, other things being equal.  So a stock's book multiple might remain below the regression line in equilibrium if has a higher beta than its peers and/or lower EPS growth expectations.

Woolworths' risk and growth characteristics suggest that it should not remain below the regression line for an extended period.  The lion's share of the company's revenues are generated in segments that are considered to be defensive, and most analysts use betas of less than 1 when constructing their discount cash flow valuations. So controlling for expected future growth, Woolworths ought to trade on a premium based on profitability adjusted P/B ratios. 

Moreover, long-term consensus expectations suggest that sell-side analysts have become too pessimistic about the stock's future growth prospects.  The long term growth forecast for the stock has fallen to only 2%, well below the median estimate (see chart).  Over the sweep of the past five decades, household spending on food & liquor has broadly tracked growth in the economy of around 5.5%.  Concerns around management quality and the long-term viability of home improvement are valid but in my view, do not justify the stock trading at a discount to its large cap peers.

Fifth, parallels between Tesco and Woolworths are exaggerated.  The collapse in Tesco's share price in 2014 owes much to the lack of transparency of its financial accounts following an accounting scandal.  Moreover, prior to the scandal, the stock was priced for perfection, trading at a large premium to its global peers on a profitability adjusted price to book ratio (see chart).  As discussed above, Woolworths is trading well below the regression line at present.

An excessive pessimism

I continue to have concerns around the long-term viability of the Masters stores in their current format, the fact that the composition senior management appears to be in a state of flux thanks to a number of recent departures, and remain sceptical of the purported synergies between running a supermarkets business and a being big box hardware retailer.  But in my view, the share price is already impounding excessive pessimism.  At these levels, investors should neutralise their underweight bet in the stock and use any renewed price weakness to start building an overweight position. 


The Jamie Durie Index, Re-visited

Inspired by Robert Shiller’s best seller, Irrational Exuberance, I developed the Jamie Durie Index (JDI) over a decade ago, which represented the number of times the name ‘Jamie Durie’ appeared in newspapers and magazines.  Shiller’s book suggested that the media typically play an important role in propagating asset price booms.  Jamie Durie -host of top rating TV show, The Block - was the poster boy of Australia’s property market culture and the JDI was designed to measure the media attention and chatter surrounding property.  As it happened, the JDI correlated closely with the cycle in house prices, with both peaking in 2003.

At the time, Australian property was booming, stories of house price gains achieved in no time with an assist from plenty of debt dominated dinner party conversation, and Australia was rapidly becoming a nation of home renovators, inspired by Jamie Durie and shows like The Block.

Fast forward to 2015 and The Block has come a long way, having out-lived its original host.  In its initial form, it survived only two seasons.  After a six year absence, the Nine Network re-introduced the show in 2010, which has been hosted by Scott Cam ever since.  Despite the 20% lift in average home values in the past three years, The Block and other home renovation shows – including House Rules and Reno Rumble - haven’t hit the heights of a decade earlier.

The rise and rise of home renovation shows...

The recently appointed Treasury Secretary, Mr John Fraser, has weighed in on the debate about whether there is a bubble in property prices, suggesting that the plethora of home renovation television shows represents compelling evidence of over-investment in housing.  While there might be signs of a property market culture re-emerging, we need to tread carefully about drawing strong inferences about a property bubble for a number of reasons.

...but little sign of a speculative frenzy

First, a shift in consumer attitudes and tastes has contributed to the proliferation of home renovation shows.  For instance, the growing popularity of cooking shows, including Master Chef and My Kitchen Rules, together with the emergence of the celebrity chef, is largely due to the renewed interest in food and home cooking and a waning interest in processed foods.  Is anyone suggesting there is a bubble in home cooked food?

Second, the aggregate data doesn’t point to over-investment in housing, just yet.  Private sector dwelling investment has lifted to a little above 5% of GDP, but this remains well below prior peaks of around 6½% (see chart).

Third, despite the growing interest in home renovation shows, this has not yet translated into a lift in the share of their budgets that consumers devote to home renovations.  That much is obvious from the fact that the value of renovations declined to 1.8% of GDP in 2014, well below the peak of 2.7% of a decade ago and its lowest level in more than twenty years (see chart).  To put this in context, had the value of renovations accounted for 2.7% of GDP in 2014, this would have translated into a dollar value of $43 billion, well above the actual spending on renovations of $30 billion, representing a shortfall of over $10 billion.

The academic literature confirms that the level of home improvement activity provides a valuable insight into home owners' expectations of future price growth.  In a paper published in the Journal of Financial Economics, Harrison Hong and other researchers from Princeton show that in the United States, homeowners who are optimistic about future house prices are more likely to speculate on future price growth by renovating.

Fourth, increased liquidity, a pre-requisite for speculative bubbles according to Shiller, has been absent to date.  In fact, the annualised turnover rate of the stock of housing has declined to 4%, around half its level from a decade ago (see chart).  Normally, turnover rises with house prices because greater home equity encourages home-owners to trade up to more expensive homes and vendors who observe higher turnover infer that demand has picked up and lift their reserves.

The RBA speculates that various factors underpin muted housing turnover: the unusually low participation of owner-occupiers in housing market transactions and growing evidence that homeowners have become more reluctant to borrow against increases in net wealth to trade up homes.  Hardly ingredients of a property bubble.

Tipping point for a bubble has not been reached...yet

Despite the proliferation of home renovation shows on Australian television, signs of a re-emerging property market culture, and strong upswing in Sydney and Melbourne property prices, the modest level of renovation activity, low turnover in the housing stock and the fact that private sector dwelling investment is in line with historical norms suggests that the property market does not yet share the speculative elements that prevailed during the boom of the early 2000s.

Back then people renovated to cash in on the soaring equity in their home so they could trade up to bigger places.  Now, the reality has set in that the transaction costs of moving are too high and households are more realistic about their expectations of capital growth.  If there does exist a tipping point for the emerging property market culture to morph into a speculative frenzy of over-investment, I believe that we are not there yet.


A less cautious consumer: Good news for discretionary retailers (finally!)

The March quarter capex survey revealed that animal spirits in the corporate sector remain dormant, with little prospect of a pick-up in non-mining investment in the near term.  The dollar value of capex for 2014/15  is set to come in at around $145 billion, 10% lower than a year earlier.  But the greater concern is that preliminary business expectations for capex in 2015/16 are comparable to those that prevailed for 2010/11.  If that year turns out to be a reliable guide, then capex is set to decline to $120 billion in 2015/16, representing an annual decline of over 15% (see chart).

Unprecedented upheaval in the corporate landscape

Faced with persistent revenue headwinds, the corporate sector faces little choice but to trim costs aggressively, restructure and lift efficiency to boost profitability and free cash flow, thus catering to investors' insatiable appetite for income.  In its recent strategy day, Woodside Petroleum was the latest in a long line of resources companies that announced a renewed focus on achieving a step down in its cost structure and lift in productivity.  It is already on that path, with capex 10% lower in 2014, and has a target of achieving a further 10-20% capex reduction by 2016.  While energy gentailer, AGL, announced at its strategy briefing this week that it would target asset sales of up to $1 billion by 2016.  Against the backdrop of the demerger wave of recent years and trend towards corporate focus, the upheaval in Australia's corporate landscape is unprecedented.

The consumer is key for reviving animal spirits

Richard Goyder, Wesfarmers' CEO, said recently that he would need to see sustained evidence of a strong pick-up in consumer spending before the company would commit to a ramping up of capital spending plans.  No doubt, this feeling is widespread amongst CEOs and CFOs across corporate Australia. 

The cautious consumer has held back investment intentions for some time now.  Since the financial crisis, the household saving ratio has hovered at or above 10%, representing its highest level in over two decades.  That is, households have been saving $10 for every $100 of gross disposable income earned since the financial crisis.  At face value, this doesn't seem high.  But to put this into perspective, the household sector saved less than $5 for every $100 of gross disposable income earned in the ten years to 2008 (see chart). 

Permanent income matters

Clearly, scared by the financial crisis and the related sharp drop in the present value of their human capital, households have taken on the task of balance sheet repair.  The persistent high level of job anxiety and proximity of the financial crisis has effectively seen households assign higher discount rates to their stream of future expected earnings.  As a result, they have been more reluctant to bring forward spending from the future to the present, so little wonder that the stock of personal credit remains below its pre-crisis peak.  Elevated political uncertainty of recent years hasn't helped consumer confidence either.

Signs of a less cautious consumer emerging

But some preliminary signs of a less cautious consumer are starting to emerge.  First, the saving rate has been on a modest downward trend since 2012, clearly helped by renewed strength in house prices, particularly across Sydney and Melbourne.  The introduction of macro-prudential measures by APRA, designed to curb the rapid growth in lending to the investor segment,  will probably moderate capital growth compared to recent years.  But the still high level of the saving ratio suggests that the medium term risks are skewed to the downside.  As the financial crisis becomes more distant, households will gradually assign lower discount rates to their future incomes, thus lifting their permanent income and encouraging them to borrow to bring forward consumption.

Second, the modest decline in the saving rate of recent years has been associated with a material pick-up in spending on durable goods, including household goods and clothing, footwear & personal accessories (see chart).  Department store sales are the only category among durable goods that has yet to participate in the recovery.

Third, there has been some renewed strength in consumer sentiment in recent months.  The inherent volatility of the series advises caution in extrapolating monthly movements into the future.  Nonetheless, the positive reaction to the Federal Budget delivered in mid-May and the strong showing in the polls by the Coalition has helped to reduce some of the political uncertainty that seems to have been a defining characteristic of Australia in recent years, particularly since the balance of power in the Senate has resided with a number of independent cross benchers.  With this Budget, the Government seems to have neutralised the bad news stemming from last year's Budget, where it spooked the electorate with talk of budget repair, hailed the end of the era of entitlement and failed to prosecute the case for the $7 Medicare co-payment.  Indeed, it is instructive that less than two weeks since the Budget was delivered, the ALP, the opposition party, has shifted the political debate to gay marriage.  Households have clearly welcomed the non-controversial budget as good news.  Consequently, I would expect that political uncertainty will continue to diminish and provide support to consumer sentiment in the near term.

The key risks to my view that the consumer will become less cautious relate to house prices, labour market slack and the already high level of household debt.  First, APRA's untested macro-prudential policies could provide a catalyst for renewed weakness in house prices.  Second, I have previously discussed the fact that considerable unemployment and under-employment in the labour market persists, which will cap wages, already growing at their slowest rate in the private sector for over a decade.  Third, the ratio of household debt to GDP in Australia remains high by global standards.  But this metric does not take into account the asset side of the household sector balance sheet.  Moreover, the ratio can be misleading because households consume out of their permanent income, not their current income. 

The maths of compounding suggests that even small declines in discount rates can have a powerful effect on boosting the present value of the household sector's human capital.  As this dynamic unfolds, households should gradually focus less on balance sheet repair and lift borrowing as their permanent income lifts.  A less cautious consumer is the key ingredient to a lift in revenue growth, revival in the corporate sector's entrepreneurial risk taking and a recovery in non-mining business investment.

Investment recommendation: Neutralise under-weight bets in discretionary retailers

After what has been a lost decade for the discretionary retailers, I believe that investors should now be starting to neutralise under-weight bets in the sector and gradually move overweight as more evidence of a less cautious consumer emerges.  Stock selection will be less important than getting the sector call right.  Nonetheless, a number of stocks stand out.  Based on a perpetuity earnings growth model, the following stocks offer the strongest upside: Echo Entertainment Group, GUD, Harvey Norman, Premier Investment, Retail Food Group and Super Retail Group.   

Despite the structural challenges facing department stores, there is some scope for catch-up for department store sales, suggesting upside risk to Myers.  See the table below for the full list of stocks.  Although some of the business models in addition to Myer face structural challenges, I believe that the market is under-estimating the powerful macro tailwind that a lift in the household sector's permanent income and present value of human capital will provide to the sector.


A new narrative for the Australian dollar (Update)

Two months ago, Evidente published a detailed report which suggested that contrary to the RBA's view that the currency remained over-valued, the Australian dollar was trading modestly below fair value of  80 US cents.  After what had been a strong period of out-performance from US dollar earners, I concluded that without the tailwind of A$ over-valuation - which prevailed through most of 2014 - their returns in the near term would be capped.  In this post, I provide an update of Evidente's A$ model and show that recent currency appreciation has been associated with under-performance from US$ earners.

Since the publication of the report on March 20th, the Australian dollar has confounded the expectations of futures markets, most market economists and the RBA, appreciating by around 3% against the US dollar.  The RBA's communications have become even more pointed about the persistently high A$.  In the statement accompanying the recent decision to cut the official interest rate by 25 basis points to 2%, the RBA Governor said that 'further depreciation seems both likely and necessary, particularly given the significant declines in key commodity prices.'  The A$ has not followed the RBA script, depreciating against the US$ by only 30% from the peak in global commodity prices in 2011, well below the 50% fall in the RBA's Commodity Price Index (in US$ terms). 

Mr Stevens is right to highlight that the A$ deprecation has been modest compared to the decline in commodity prices in the past four years.  But over the sweep of the post float period, the A$ typically has not moved lock in step with swings in commodity prices.  For instance, the appreciation through the mid-2000s was muted given the size magnitude of the upswing in commodity prices.  In the five years to mid-2008, the A$ had appreciated by 40% against the US$, but the RBA’s Commodity Price index more than tripled in US$ terms over this period (see chart).  During this time, the RBA did not acknowledge publicly that the A$ remained substantially below its fundamental value.

Despite the modest lift in commodity prices in recent months, and the further easing of monetary policy in Australia in early May, Evidente's econometric model of the A$ points to fair value of around 79-80 US cents.   The key innovation of the model is that it utilises an interest rate differential variable based on a negative or shadow Federal Funds rate, developed by Leo Krippner at the RBNZ.  The modest under-valuation that prevailed at the time of publication of the original report has now dissipated and the A$ is trading in line with fair value (see chart).

After what had been an extraordinarily strong period of returns from US$ earners in the six months to April, the renewed A$ appreciation has been associated with under-performance from this basket in recent months (see chart). 

The table below provides the list of big-cap US dollar earners.  The basket is trading on a median 12 mth forward PE of 20x, which represents a 25% premium to the median estimate for the ASX100 and is slightly higher than historical norms.  The basket trades on a premium because offshore earners exhibit significantly higher long-term growth expectations and lower betas than the broader market.  Their low betas arise from the predominantly defensive nature of their cash flows and business models.  The three stocks that suffer from the highest level of analyst bearishness remain Cochlear, Treasury Wine Estates and Westfield, which each attract less than 20% of buy recommendations from sell-side analysts.


Lifting the lid on the Sage of Omaha's investment secrets

More than 40,000 people undertook the pilgrimage to Nebraska to attend Berkshire’s Hathaway’s AGM on May 2nd.  They had good reason to listen to the insights of Chairman, Warren Buffett, considered by many to be the greatest investor of modern times.  Berkshire Hathaway, the company he founded almost fifty years ago, has delivered to shareholders compound annual growth in returns of over 20 per cent over this time, handsomely beating the S&P500.

Some have taken Mr Buffett’s stellar track record as compelling evidence that active management can deliver consistently high returns over the long run.  Others attribute his success to luck; by chance, a small handful of funds will inevitably beat the benchmark over an extended period. 

Researchers at AQR Capital, a US based hedge fund, have recently sought to understand the reasons for Berkshire Hathaway’s strong performance.  In their working paper, Buffett’s Alpha, Andrea Frazinni and his co-authors attribute the strong returns not to luck, but to reward for leveraged exposure to safe, quality stocks that are cheap.

Modern portfolio theory says that a stocks’ beta dictates its expected future returns.  This means that a high beta stock should yield high expected returns because it is very sensitive to fluctuations in the economic cycle.  For instance, mining firms, building material stocks and discretionary retailers are considered to have high betas since their profitability is largely tied to the fortunes of the economy.  According to theory, these sectors should yield higher returns than low beta or defensive sectors such as healthcare, consumer staples and telecommunications.

Investors with a strong risk appetite can juice up their portfolio returns by choosing to invest in predominantly high beta stocks.  Alternatively, leverage can also play an important role by allowing investors to amplify their returns.  Investors wanting to take on more risk can borrow and use the proceeds to gear up their exposure to the market.  Many retail investors engaged in this type of behaviour through margin lending for instance, during the credit boom in the lead up to 2008.

Contrary to theory, the overwhelming evidence compiled over the past three decades - led by Nobel prize winning economist Eugene Fama - has shown that high beta stocks have yielded worse returns than low beta stocks. Moreover, the assumption surrounding leverage comes unstuck in the real world.  Despite the rapid growth of hedge funds in recent decades, the lion's share of financial assets is still managed by institutional investors who are subject to leverage constraints; their mandates typically prevent them from borrowing or short-selling.

Betting against beta

In an environment where most institutional funds are subject to borrowing constraints, the obvious way to beat one’s peers is to gravitate towards high beta or risky stocks, especially those with supposedly strong growth prospects that easily capture investors’ imagination.  But crucially, these stocks become over-bought and expensive, and many fail to deliver on analysts' wildly optimistic growth expectations, which underpin their poor future returns.  Some high profile examples that fit this picture in Australia recently include: Woolworths, REA Group and Navitas.

Accounting for the tendency for high quality, defensive and cheap stocks to out-perform accounts for much of Mr Buffett’s performance over time.  Mr Buffett clearly identified many years ago that the ability and willingness to borrow heavily and bet against beta would yield remarkably strong returns.  The authors conclude that that the Sage of Omaha’s performance is not attributable to luck or chance, but rather the successful implementation of exposure to value and quality factors that have yielded strong returns over time.

Applying Buffett's Investing Principles to Australia

I have developed a number of screens for the ASX200 that represents proxies for Mr Buffett’s three preferred attributes: quality, safety and value.  Stocks need to attain a score better than the median across each of the categories to get into the long portfolio.  Three stocks that meet the criteria include: CSR, Echo Entertainment Group and IAG.  The full text report contains a full list of the thirteen stocks in the long portfolio and how they score across the quality, safety and value screens. 

Conversely, the short portfolio is composed of stocks that fail to meet the threshold across each of the three screens.  Three stocks in the short portfolio include: Oil Search, Premier Investment and Caltex.  The full text report contains a full list of the eleven stocks in the short portfolio.


A rate cut today, but what of tomorrow?

"Relevant considerations of late include the fact that output is below conventional estimates of ‘potential’, aggregate demand still seems on the soft side as resources investment falls sharply, and unemployment is elevated and above most estimates of ‘natural rates’ or ‘NAIRUs’. And inflation is forecast to be consistent with the 2–3 per cent target. So interest rates should be quite accommodative and the question of whether they should be reduced further has to be on the table." 

 - Glenn Stevens, RBA Governor, 21st April 2015

More policy easing appears to be imminent.  Interbank futures suggest there is a 70% probability of a 25 basis point rate cut at today's RBA Board meeting, while the overwhelming majority of market economists expect the RBA to ease policy today.

In December last year, in an interview to Fairfax journalists, Mr Stevens appeared to subtly acknowledge the case for more accommodative policy and laid the groundwork for a new communications strategy based on a positive narrative.  The RBA would want to avoid any further rate cuts being seen to reflect a weak economy, at a time when household and business confidence were (and still are) fragile.  Mr Stevens also indicated that the precipitous fall in energy prices would reduce inflation.

I believed that the benign inflation environment provided a cue for the RBA's positive narrative (see Evidente blog post, Money's too tight to mention, 12th December 2014) and expected that the RBA would ease policy at the February and May meetings, immediately following the release of quarterly CPI data (Australia is unique globally in having a quarterly CPI; most countries have monthly CPI readings).  The CPI release from last week confirmed that underlying inflation remains in the lower part of the RBA's 2-3% target range and that the inflation outlook does not pose an obstacle to lower interest rates.

The RBA's communications suggest that it is carefully calibrating monetary policy in the context of its policy of least regret, which assesses the likelihood and size of costs associated with making a policy error.  Most market economists, central bankers, prudential regulators and analysts are based in Sydney and Melbourne, where capital growth in housing has been strongest of late.  Moreover, the recent memory of sharp falls in house prices and the contagion effects across the United States, Europe and China is clearly influencing the RBA's cautious approach.  In seeking to contain the risks of speculative activity in housing, Mr Stevens is clearly wanting to avoid similar policy errors that he believes contributed to the credit boom and bust. 

But the RBA is also keen to contain the costs associated with growing unemployment and under-employment.  In a recent blog post (Beware of bubble talk for now - Part II, April 29th), I show that there is considerable slack in Australia's labour market: the unemployment rate of 6.1% is high amongst a group of developed countries, unemployment has remained above 6% for ten months, the longest stretch since 2003, the duration of unemployment has increased to a decade high, and the participation rate and employment to population remain low, which point to a strong discouraged worker effect.

It is telling that In the latest monetary policy minutes from April, the RBA acknowledges that labour market conditions are likely to remain subdued and that the economy is expected to operate with a degree of spare capacity for some time.  In the minds of the RBA, the more serious policy error at this juncture appears to be keeping policy unchanged.  Against this backdrop, market participants will need to become accustomed to more noise from the RBA and APRA about the use of macro-prudential to contain risks stemming from housing.  In terms of timing, the Board members also saw benefits in waiting for more data, including on inflation.

In the likely event that the central bank cuts the Overnight Cash Rate today to 2%, investors' focus will inevitably shift to what next?  Due the RBA's concerns about housing, I expect that the policy rate will remain on hold for the remainder of the year, because the central bank will want time to assess the impact of the two rate cuts.  My expectation is that the statement accompanying today's decision will therefore likely quell expectations of another rate cut in the near term, which will provide some support to the Australian dollar.

An open letter to Woolworths CEO, Grant O'Brien

Dear Mr O'Brien,

After what has been a difficult period for Woolworths - which has seen the market de-rate the stock following the recent downgrade to FY15 NPAT guidance -  a lot clearly rides on the upcoming investor strategy day on May 6th.  You have drawn attention to subdued trading conditions in Food & Liquor, evident from as early as August last year, and confirmed by the marked slowdown in sales growth in the supermarket and petrol divisions for the latest calendar year (see chart).

You have also highlighted that General Merchandise continues to be affected adversely by the Big W business transformation, hotel earnings have been impacted by the additional Victorian gaming tax, while the expected timing of break-even for the Masters rollout continues to be pushed back.

The market's verdict in the past six months has been unequivocal; the price of Woolworths shares have declined by 10-15%, while the market has risen by around 5%.  Over the sweep of the past four years -  which coincides with your tenure as CEO - the performance of Woolworths shares broadly tracked those of Wesfarmers up until six months ago, at which point your shares have strongly underperformed not just Wesfarmers but also the ASX100 ex-financials and resources (the peer group which is used to benchmark hurdle rates for your senior executives' Long Term Incentives) - see chart.  Unless you can turn around expectations at the strategy day and the remaining two months of the financial year, Woolworths is set to miss the threshold for the Total Shareholder Return hurdle rate for the second year running (but more on remuneration later).

Even against a peer group of large global food & grocery retailers, Woolworths has been amongst the group of stocks that has delivered negative excess returns or alpha in the past four years (see chart).

The significant downgrade to analysts' EPS forecasts that has occurred in recent months largely reflects a re-assessment of Woolworths' ROE prospects.  Analysts are now projecting the company to achieve an ROE of below 22% twelve months ahead, well below the 25% they had projected as recently as in October last year (see chart).  This continues a trend of deteriorating ROE prospects that date back to 2011, when brokers were forecasting Woolworths to deliver an ROE of over 30%.

The deterioration in the marginal ROE from 2011 coincides with the rollout of the Masters Home Improvement stores, to the point where the marginal ROE has recently turned negative (see chart). 

In 2011, the proposed expansion into home improvement would have seemed a sensible strategy.  Wesfarmers had demonstrated an ability to successfully manage hardware stores and supermarkets, while the free cash flows generated from Woolworths supermarkets would effectively fund the roll-out of the Masters stores.

But the expansion into home improvement has clearly pulled down the profitability of the broader group and has distracted your (and other senior executives') attention from Woolworths' core supermarkets business, which has probably contributed to the marked slowdown in sales growth from that segment in the past year.  Moreover, few in 2011 expected investors to develop an insatiable appetite for income, that would see many companies defer or abandon growth options completely to cater to this growing demand for dividends. 

At a time when Australia's corporate sector is undergoing a demerger wave, spinning off non-core business assets, Woolworths has bucked the trend towards corporate focus by expanding organically into home improvement, where the synergies between running supermarkets and hardware stores are questionable (despite Wesfarmers' success in managing Coles and Bunnings). 

Drawing on international evidence, few of the largest globally food & grocery retailers run hardware stores.  Evidente's proprietary index of corporate focus shows that Wesfarmers and Woolworths are among the least focussed food & grocery retailers globally (see chart).  Corporate focus is but one of a number of factors that govern performance; indeed focussed firms like Tesco and Sainsbury have delivered dreadful returns in recent years.  Nonetheless, the missteps associated with the Masters rollout, deterioration in group profitability and ongoing adverse impact of the business transformation of Big W are clearly distracting you and senior management from Woolworths' core supermarket business.

Structure of financial incentives helps to ameliorate agency costs

Having read the Woolworths remuneration report in detail, as well as those of your peers both in Australia and globally, the key hurdle rates contained in the Short Term and Long Term incentives appear to be reasonable.  Contrary to conventional wisdom, I do not believe that the sales targets that form part of the STIs have unduly distorted executives' behaviour to chase sales at the expense of profitability.  Among the STIs, the hurdle rate at the group level is NPAT growth, while the divisional hurdles include not just sales, but also profit, return on funds employed and cost of doing business.

If I was to quibble about the remuneration structure, it would be the gradual lowering of the EPS growth hurdles in recent years that form part of the LTIs, from 10%-15% in F09-F11 to 6%-8%.  But this is not unique to Woolworths; other companies have also lowered their EPS growth hurdles in the face of persistent revenue headwinds in recent years.

license to operate not to be taken for granted

You would no doubt be aware of the Four Corners program (Slaving Away) that went to air on May 5th, which showed damning evidence of exploitation of migrant workers in Australia's fresh food supply chain.  The allegations affect most of Australia's stores that sell fresh produce to the public, including Woolworths, Coles, Aldi, IGA and others.  Four Corners has posted to its website the written responses from each of these businesses, including Woolworths.  Although each of the supermarket chains deals with hundreds, possibly thousands of suppliers, the big supermarket chains need to be careful about managing their reputational risk, particularly as the community and governments have effectively conferred a license to operate to Woolworth, Coles and other supermarkets.  The sheer size of Woolworths and Coles suggest that they have more to gain from leading the charge and ensuring that their suppliers do not engage in worker exploitation.  Thus any detail at the investor strategy day around your proposed pipeline of cost savings in excess of $500 million and expected impact on suppliers will need to be carefully communicated and managed.

corporate focus will be rewarded

I believe that investors will reward Woolworths if at the investor strategy day you articulate a vision and future for the company that has a renewed focus on its core business of supermarkets.  You have previously demonstrated an ability and willingness to sell under-performing non-core businesses such as Dick Smith.  Perhaps your greatest legacy to the company you have worked at since a teenager will be to have the courage to admit to past failures and exit home improvement, while re-assessing the synergies that exist between general merchandise and supermarkets.